The east coast low delivered further substantial rainfall for the 26 and 27 August which resulted in flooding for the affected areas. The same weather system contributed to Warragamba Dam spilling for the first time since March 2012.
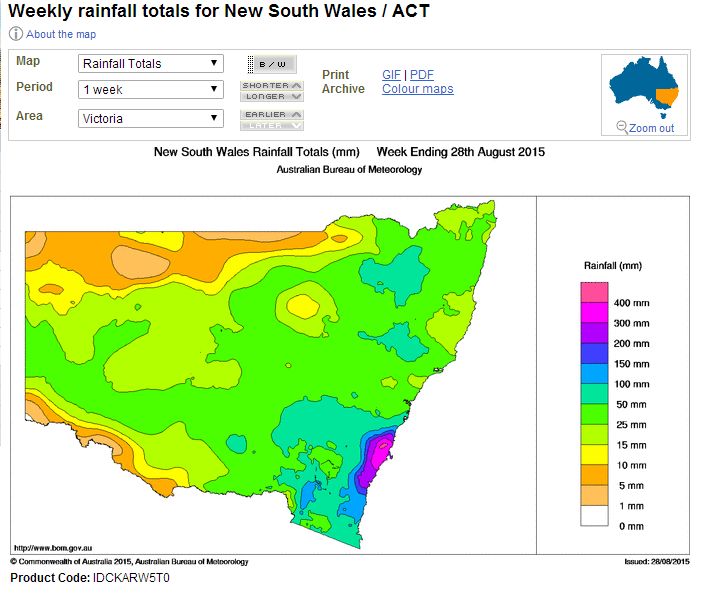
The attached plot acquired from the Water and the Land (Acquired from BOM dated 29/8/15) for the 1 week ending 28 August 2015 is showing that the south east coast of New South Wales especially within an area from the Illawarra south to near Ulladulla on the South Coast having received the heaviest falls of between 300 mm and 400 mm as accumulative totals.
A very small area inland from Kiama may have received in excess of 400 mm. There were also 200 mm plus totals (accumulative totals) within an area from Ulladulla to Batemans Bay in the south.
A large area of south east New South Wales received between 50 mm and 100 mm of rain from the event and a substantial area of the state received from 25 mm to 50 mm.
It is also identified that good rainfalls fell across North East Victoria and eastern Victoria.
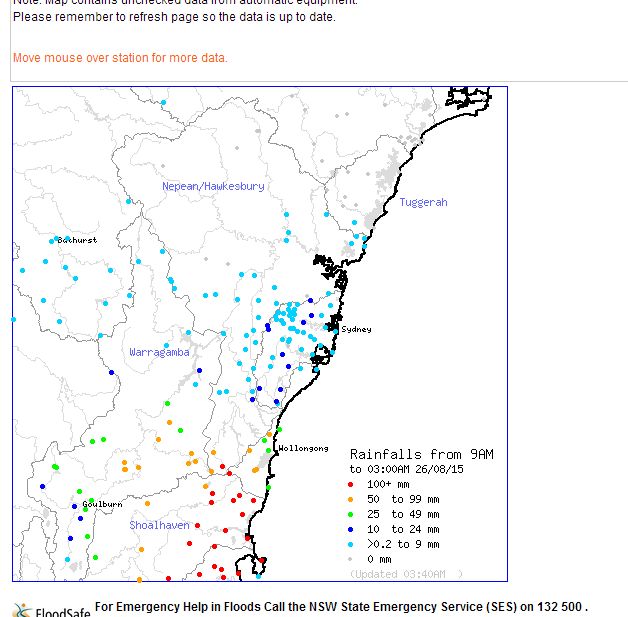
To provide some guidance of what was occurring on the 26 August, the following rainfall totals had occurred to 3 am 26/8/15:-
Hampden Bridge - 203 mm.
Wattamolla (South of Wollongong) - 197 mm.
Tomerong - 195 mm.
Sassafras - 175 mm.
Porters Creeks Dam 180 mm.
Brogers Creek - 178 mm.
Greenwell Point - 164 mm.
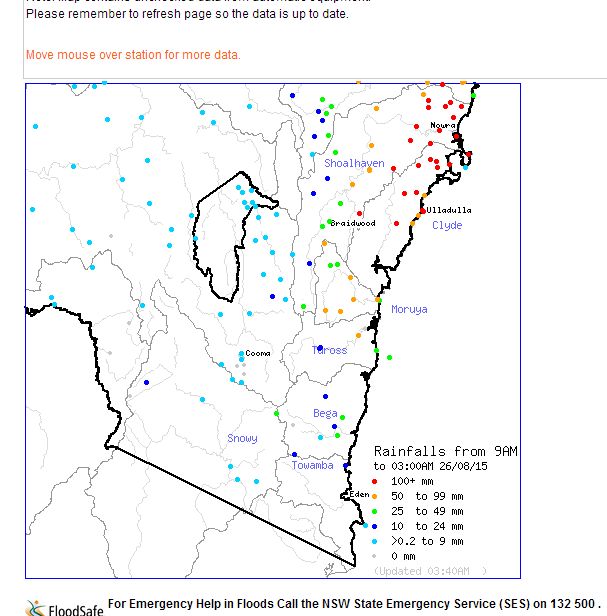
On the South Coast, the following rainfall figures had occurred to 3.30 am 26/8/15:-
Nowra 175.4 mm.
Ulladulla 111 mm.
Moruya - 79 mm.
These are some of the heaviest falls that had occurred at that time.
I had to drive to Albury early Wednesday morning and as it was, I found myself driving through some of the heavy rain that was occurring especially from south of Campbelltown to Goulburn. The heaviest falls were found to be within a small area near Mittagong. By the time I had reached Goulburn the rain was becoming lighter. At daybreak, I noted that many streams and creeks had substantial water flowing through them.
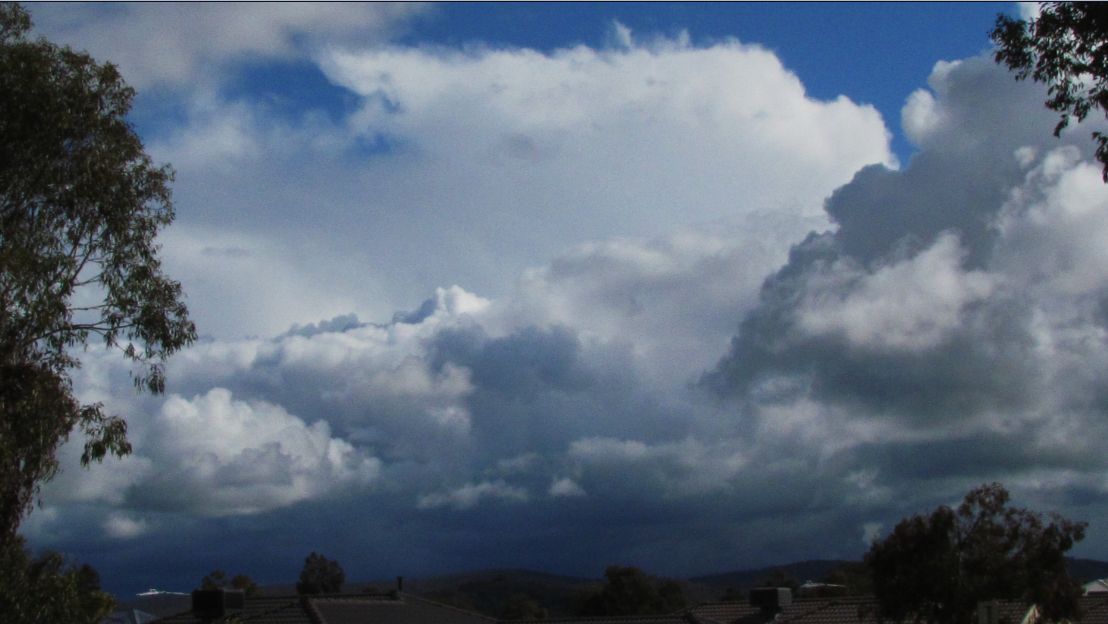
I stayed at Albury and noted that the same system had delivered some good rainfall totals in that area being 40 mm to 50 mm and an afternoon thunderstorm (cold weather thunderstorm) was observed on Thursday afternoon as shown in the attached photo. The storm did not last long.
The three day rainfall figures for four towns in the affected area include:-
1 - Batemans Bay - 103 mm (25/8), 140 mm (26/8) and 8.2 mm (27/8). Total rainfall for the period 1 to the 29 August 2015 is 274.9 mm whereas the monthly average should be 63.8 mm.
2 - Kiama - 170.4 mm (25/8), 77.8 mm (26/8) and 15.2 mm (27/8) - Total rainfall for the period 1 to the 29 August 2015 is 269.6 mm whereas the monthly average should be 52.3 mm.
3 - Nowra - 182 mm (25/8), 208 mm (26/8) and 23.2 mm (27/8) - Total rainfall for the period 1 to the 29 August 2015 is 431.6 mm whereas the monthly average should be 47.7 mm.
4 - Ulladulla - 169.8 mm (25/8), 113 mm (26/8) and 14 mm (27/8) - Total rainfall for the period 1 to the 29 August 2015 is 345.8 mm whereas the monthly average should be 64.4 mm.
This gives an idea of the impact of the weather event to the region.
The event contributed to flooding in the Kiama and Ulladulla regions and based on media reports, up to 1,000 calls to the SES for help.
The photo of the afternoon thunderstorm was taken at Springdale Heights looking south west towards Nail Can Hill 27/8/15. This storm was short lived but demonstrated that the same weather system had an impact even this far inland.