
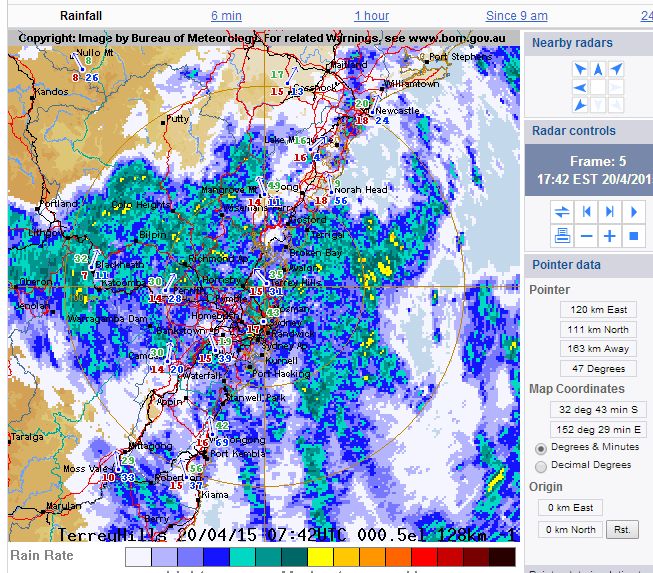
As per weather forecasts, a significant rain event is now unfolding across Sydney and the Illawarra region which will continue for some time. As shown in the attached radar image, the rain is currently being concentrated through Sydney and the Illawarra region.
Light rain through Sydney commenced early before dawn but it was not significant. As the day continued showers intensified into rain periods. On my way home from work, I found myself driving through some heavy rain including localised flooding across roads and much runoff near Parramatta.
At the same time, I was hearing on the radio WSFM that a road in Mona Vale had been cut as a tree had fallen and news bulletins now advise of some power loss across Hornsby with SES crews attending many jobs mainly for leaking roofs and local flooding.
This is occurring as an east coast low forms and intensifies off the New South Wales coast. It appears it will form off Newcastle or nearby but its exact position is still uncertain. It is known that to date, a wind gust of 89 km/h has been recorded at Sydney Airport at 6pm as the weather system intensifies.
Heavy rain has been a feature over the past few hours with suburbs such as Hornsby receiving 47 mm of rain from 9 am to 5.30 pm (20/4/15) being the highest across Sydney followed by 45 mm at Frenches Forest.
Heavier rainfall has occurred around Wollongong including 78 mm at Wattamolla and 72 mm at Foxground for the period 9 am to 5.30 pm (20/4/2015).
As this system continues please feel free to contribute to the discussion given that this could be a significant weather event for the New South Wales coast.
Early Monday morning light rain commenced across Sydney but it was not significant for most areas. The heaviest total to 9 am 20/4/2015 included a relatively isolated fall of 24 mm at Frenchs Forest. In general:-
– The north east suburbs had anywhere from 13 to 24 mm.
– The west and southern suburbs had anywhere from 2 mm to 10 mm.
Since 9 am, this has changed dramatically with the majority of Sydney receiving between 26 mm and 47 mm for the period 9 am to 5 pm.
There have also been wind gusts to 61 km/h recorded at Sydney Olympic Park.
WOLLONGONG TO ULLADULLA
The town of Ulladulla received 29.6 mm to 9 am (20/4/2015) and another 29.4 mm from 9 am to 5.30 pm. The most dramatic feature here is that wind gusts of 87 km/h have been occurring with such gusts occurring at 12.30 pm and 3.30 pm respectively.
The heaviest rainfall for the period up until 9 am across the region includes:-
Currarang – 43 mm.
Vincentia – 42 mm.
Foxground – 36 mm.
This shows that some reasonable totals had occurred along the coast south of Sydney prior to 9 am.
Since this time, much heavier totals have occurred across the Illawarra region. The totals are from 9 am to 5.30 pm only. They include:-
Wattamolla – 78 mm.
Foxground – 72 mm.
Reverces – 65 mm.
Darkes Forest – 64 mm.
Wollongong – 55.8 mm.
Rainfall for the period 9 am to 5.30 pm has been heaviest around Wollongong.
There have also been wind gusts of 63 km/h recorded at Wollongong Airport.
NORTH OF SYDNEY TO NEWCASTLE
For the period 9 am to 5.30 pm (20/4/2015), some reasonable totals include:-
Wallsend (Newcastle) – 61 mm.
Maroota – 58 mm.
Another feature of this system is the cold temperatures that have occurred. At Nowra for example, the maximum temperature barely reached 13.2C due to what was occurring.
I attach the rainfall plot for New South Wales to this post to show the event commencing. It relates to rainfall only to 9 am 20/4/2015 and it is not representative of what has occurred after 9 am.
Overall, the above discussion identifies that the event has developed over Sydney, north to Newcastle and south to Ulladulla on the New South Wales south coast.
You were spot on Harley Pearman – steady rain across Sydney at the moment. You can see the low off the Newcastle coast.
You were spot on Harley Pearman – steady rain across Sydney at the moment. You can see the low off the Newcastle coast.
Predictions for 100mm in parts of the Newcastle region and Central Coast on both days. It would not surprise me with that scenario of locations getting over 200mm from this event.
Predictions for 100mm in parts of the Newcastle region and Central Coast on both days. It would not surprise me with that scenario of locations getting over 200mm from this event.
As identified in another post heavy rain has been a feature for the Illawarra, Sydney, Central Coast, Newcastle and Hunter regions. For the 24 hours to 9 am 21/4/2015, some very significant rainfall through Sydney includes:-
Waitara – 174 mm.
Hornsby – 172 mm.
Turramurra – 167 mm.
North Parramatta – 143 mm.
Sydney Olympic Park – 137 mm.
Richmond and Kings Langley – 122 mm.
Blacktown – 101 mm (Its very rare to get a 100 mm fall where I live).
I attach the rainfall plot for Sydney for the 24 hours showing this.
Early Tuesday morning at sunrise, I was fortunate enough to head down to some parklands at Duck River Auburn and photograph some local flooding. While not as dramatic as to what has occurred elsewhere including the Hunter Valley, there was enough rain to create some nuisance flooding along the Duck River Parklands at Auburn as shown. It does take allot of rain to create this effect across the parklands.
Outside Sydney, heavy rain has been a feature for the affected area. The heaviest totals as shown include:-
BLUE MOUNTAINS
Katoomba – 142 mm.
Medlow Bath – 140 mm.
Blackheath – 133 mm.
ILLAWARRA
Robertson – 136 mm
Burrawang – 125 mm.
CENTRAL COAST
Maroota – 166 mm.
Kulnurra Hill – 152 mm.
Wisemans Ferry – 143 mm.
Woy Woy – 128 mm.
NEWCASTLE AND HUNTER (Close to Newcastle)
It is identified that the Hunter Valley is worst affected with evacuations, major flooding and even fatalities. The events are covered by the media in great detail and hence will not be repeated here.
Crawford – 259 mm.
Tocal – 245 mm.
Tangary Mountain – 235 mm.
Seaham – 213 mm.
Clarence Town – 212 mm.
Wallsend – 187 mm.
Williamstown – 156 mm.
Amazing there is a sharp drop in rainfall north of the lower Hunter. This is seen at Forster – Tuncurray whereby just 17 mm fell being on the edge but nearby Tiona a few kilometres to the south had 76 mm.
There are some big falls at Maitland for the period after 9 am with 274 mm falling at Belmore Bridge (Maitland) (Period is 8 hours to 5 pm) – Station Number 61268.
I attach the region rainfall plot for the period to 9 am.
WIND
In addition to the heavy rain, wind has been a feature of this system. Trees have been brought down and I was even made aware of a downed tree impacting an intersection on Wellington Road – Auburn.
The weather station (66208) being Wattamolla has been recording some very strong winds over the period as shown.
20/4/2015
117 km/h gust at 2.25 pm and 2.30 pm.
120 km/h gust at 4.30 pm.
132 km/h gust at 6.10 pm.
Midnight – Wind speed of 100 km/h per hour is recorded with a peak gust of 120 km/h.
21/4/2015
135 km/h gust at 9.05 am.
124 km/h gust at 10 am.
This shows this is a very serious storm and rain event although such gales are limited to the coastal fringe and seawards.
It is identified that this system is causing havoc and I heard on the WS FM news that some 100,000 residents or so had no electricity early this morning across Sydney and the Central Coast due to downed trees and power lines.
Driving home from work was difficult and slow due to the nature of the weather.
http://www.extremestorms.com.au/heavy-rain-east-coast-low-nsw-coast-20-to-23-april-2015/#comment-2868
I have provided a comprehensive outline of the rain including a couple of photos of some flooding at Auburn early today from this event.
http://www.extremestorms.com.au/heavy-rain-east-coast-low-nsw-coast-20-to-23-april-2015/#comment-2868
I have provided a comprehensive outline of the rain including a couple of photos of some flooding at Auburn early today from this event.
For the 24 hours to 9 am 22/4/2015, further heavy rainfall occurred across the Hunter region south to the Illawarra region. The heaviest totals include:-
HUNTER VALLEY
Maitland – Belmore Street – 308 mm (This includes a fall of 274 mm between 9 am and 5 pm on Tuesday).
Seaham – 198 mm (This is some 411 mm in 2 days).
Nelson Bay – 140 mm.
Pokolbin – 137 mm.
Wallsend Bowling Club – 131 mm (This is some 318 mm in 2 days).
CENTRAL COAST
Mount Elliot and Wyong (Olney Street) – 131 mm.
Maroota – 121 mm (This is some 287 mm in 2 days).
SYDNEY
Falls were a little lighter but still significant.
Lucas Heights – 136 mm.
Hornsby – 134 mm (Some 306 mm in 2 days).
Waitara – 130 mm (Some 304 mm in 2 days).
St Ives – 121 mm.
Toongabbie – 126 mm.
Kings Langley – 128 mm (Some 250 mm in 2 days).
Turramurra – 127 mm.
Blacktown 88 mm (Some 189 mm in 2 days).
There are further images of flooding from this event on a separate post taken at Auburn to highlight what was occurring,
ILLAWARRA
Darkes Forest – 160 mm.
Beaumont (The Cedars) – 159 mm.
Barrengarry – 123 mm.
Robertson – 110 and 115 mm from two local weather stations close together.
The rainfall plots are provided below.
This event has caused serious flooding across the Hunter region with local rivers bursting their banks. There are two graphs generated for:-
1 – Hunter River at Belmore Bridge.
2 – Patterson River.
It is worth posting these as they show how rapid the flooding was in the local river systems.
The Belmore Bridge (Maitland) station recorded 274 mm of rain in 8 hours from 9 am to 5 pm. The impact of that is dramatic on water levels. Notwithstanding the property damage and damage to infrastructure, the plots themselves are dramatic as the river rises are sharp. One can see why this event had such a major impact on the lower Hunter region.
Please find attached the rainfall plot for Sydney for the 24 hours to 9 am Thursday morning being the 23/4/2015.
During Wednesday afternoon, conditions began to ease with rain easing to showers. Heavy morning rain broke to scattered showers which tapered off during the afternoon. The highest rainfall for the period include:-
Cronulla – 92 mm.
Blacktown – 78 mm.
Royal National Park – 64 mm.
Bankstown and Woodville Golf Club (Guildford) – 61 mm.
North Parramatta – 60 mm.
The rain became more focused around Sydney before easing during the afternoon. There were also heavy falls around the Illawarra as follows:-
Brogers Number 2 (Brogers Creek) – 113 mm.
Roberton – 108 mm.
Foxground – 104 mm.
There were also reasonable totals further south on the south coast including:-
Regatta Point – 84 mm.
Green Cape – 77 mm.
Nimmitable – 67 mm.
Bendethera – 54 mm.
Merimbula – 53 mm.
The relevant plots are provided. This post will now be concluded. The impact of this event across the three days has caused major chaos including disaster declarations across several areas. A summary of what has occurred and the impacts this has had on communities including cumulative rainfalls will be described under a new heading.