
A feature of the recent rainfall event across south east Australia was its longevity and the amounts that fell during the 4 day period.
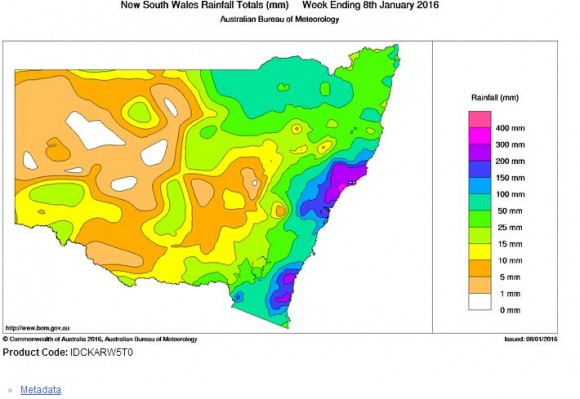
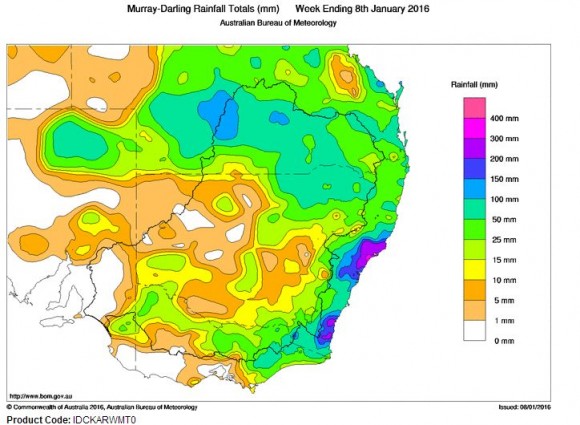
When considering the cumulative rainfall, it is clear some regions have by far exceeded the average January rainfall by a significant amount. The heaviest cumulative falls occurred within the following regions:-
1 - A pocket centred wholly on Newcastle and its surrounds where as much as 300 mm or more fell.
2 - Lower North coast where as much as 200 to 300 mm fell.
3 - South coast centred on Batemans Bay, Moruya and Narooma regions where 150 to 200 mm fell.
4 - Northern Sydney where as much as 200 mm fell.
5 - Inland Central Queensland where falls reaching 100 to 150 mm fell.
Some of the falls are exceptional and contributed to the following incidents:-
- Major flooding around Raymond Terrace, Dungog and Newcastle.
- SES responding to 1,796 calls.
- 21 flood rescues.
- Up to 100 car accidents.
A clean up is now beginning as waters subside and clear weather takes hold. Cumulative rainfall for the week ending 8/1/2016 for Sydney include:-
Frenchs Forest - 248 mm.
St Ives - 226 mm.
Turramurra - 224 mm.
Kurrajong Heights - 221 mm.
Castel Hill - 207 mm.
Castle Cove - 203 mm.
Belrose - 195 mm.
Macquarie Park - 187 mm.
Berowra - 186 mm.
Sydney Olympic Park - 174 mm.
Richmond Airport - 157 mm.
Abbotsford - 153 mm.
The northern half of Sydney was highly affected as evident by flooding in low lying areas across the north west thus making this a very significant event for January.
Blacktown where I live had approximately 172 mm based on data from the closest rain gauge.
South Coast.
Cumulative rainfall for the week ending 8/1/2016 for the South Coast include:-
Moruya Airport - 199 mm.
Batemans Bay - 170 mm.
Moruya Heads - 154 mm.
Narooma - 131 mm.
Cumulative rainfall for the week ending 8/1/2016 for the Central Coast include:-
Lake Macquarie - 250 mm
Mangrove Mountain - 241 mm.
Wyee - 219 mm.
Gosford - 161 mm.
Cumulative rainfall for the week ending 8/1/2016 for the Hunter and Lower North Coast include:-
Clarencetown - 387 mm (The highest that can be ascertained)
Main Creek - 345 mm.
Williamtown - 325 mm.
Newcastle University - 317 mm.
Patterson - 313 mm.
Nobbys Head - 307 mm.
Upper Chichester - 301 mm.
Tocal - 298 mm.
Maitland - 252 mm.
Dora Creek - 234 mm.
Cessnock Airport - 173 mm.
Forster - 192 mm.
Old Bar - 135 mm.
Taree - 132 mm.
The above and the attached plots from the Bureau of Meteorology “Water and the Land” shows that the Lower Hunter was worst affected by this event. Conditions have now cleared with flood waters expected to subside in coming days.