As mentioned in a previous post, a tropical cyclone was expected to form during the week and possibly make landfall at or close to the city of Townsville North Queensland late Thursday.
In terms of accuracy, the BSCH Models to deduce this a week ago proved to be relatively accurate as the storm did in fact cross the coast over the Townsville city region late Thursday evening and into the night.
However, this was an unusual storm for the following reasons which was not expected:
- The storm struggled to form and thus its life span was much shorter than initially expected. In this regard, the storm only remained a tropical cyclone for a short period of time being approximately 1 day.
- The heaviest rain from the storm fell to the north of the eye. Usually, the heaviest rainfall would occur on the east and south side of the eye but in this case, this did not occur. As such, rainfall over Townsville City was not excessive being 25 mm to 78 mm. The heaviest rain fell to the north where some localities had between 150 and 200 mm such as Paluma Alert - 176 mm and Running River (Hidden Valley) 189 mm being the highest totals.
- There are also doubts of its true intensity.
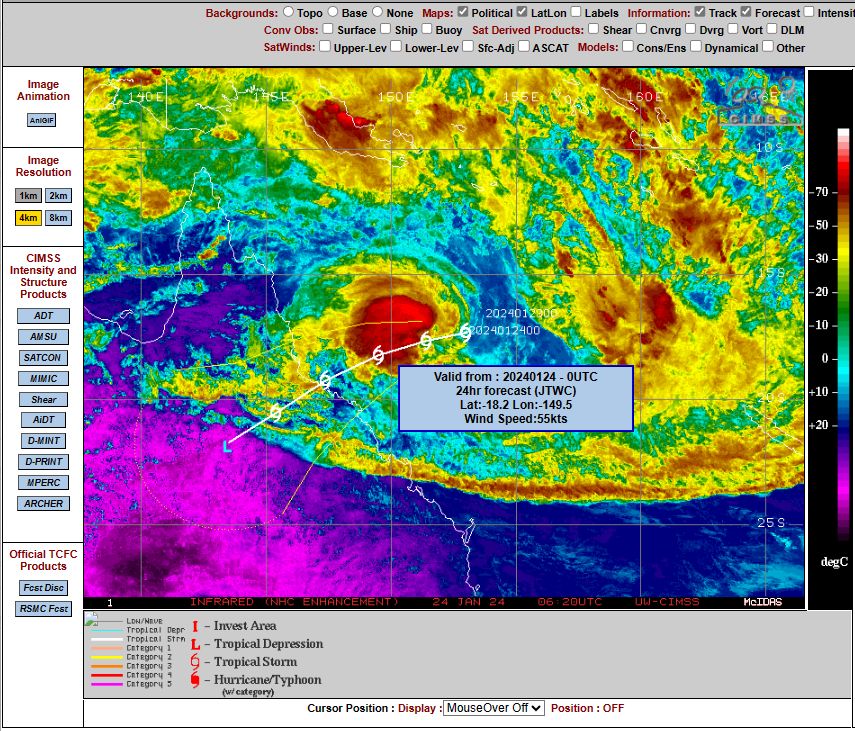
When reviewing the CIMSS models in terms of intensity of this, their models suggested a tropical storm as shown with peak wind gusts to 55 knots (102 km/h). The peak wind gusts experienced at or around Townsville City were between 93 and 100 km/h. The CIMSS model is accurate.

This would imply a storm below tropical cyclone strength on the Saffir Simpson Scale being an intense tropical storm at landfall.
There were enough weather stations available to record this event and as such, a high degree of accuracy is available even at sea.
A weather station at Flinders Reef recorded peak wind gusts to 143 km/h with average speeds of 115 km/h at 12.30 pm on Thursday. Furthermore:
- 55 am - Peak wind gusts to 139 km/h with average speeds of 107 km/h.
- 1 pm - Peak wind gusts of 133 km/h with average speeds of 109 km/h.
The period between 11.30 am and 3.30 pm is showing some interesting wind gusts which clearly exceeds the CIMSS model ensembles. During this period, the storm would have fit the strength of a Category 1 system under the Saffir Simpson Scale.
Under the Australian Tropical Cyclone Intensity Scale of 1989 at this intensity, the storm would be classed as a Category 2 system at peak intensity.

At landfall, the storm had weakened somewhat to a strong tropical storm under the Saffir Simpson Scale and a Category 1 system under the Australian Tropical Cyclone Intensity Scale 1989.
The recordings at Flinders Reef are attached with the strongest wind gusts highlighted.

There is some damage including power outages across wide parts of Townsville but overall, a significant impact upon a major urban centre of Queensland has been avoided.
The system has since weakened to a tropical depression and has moved well inland dropping rainfall across inland central regions.

Attached are:
- CIMSS Plots showing the storm.
- NASA Zoom Earth satellite image - The Category 2 storm at peak intensity is relatively accurate (Using the Australian Tropical Cyclone Intensity Scale 1989).
- Flinders Reef weather station showing peak wind gusts of the storm dated Thursday 25 January 2024.
- Google Earth image of Townsville looking south west with the location of the most significant wind and rain events plotted.