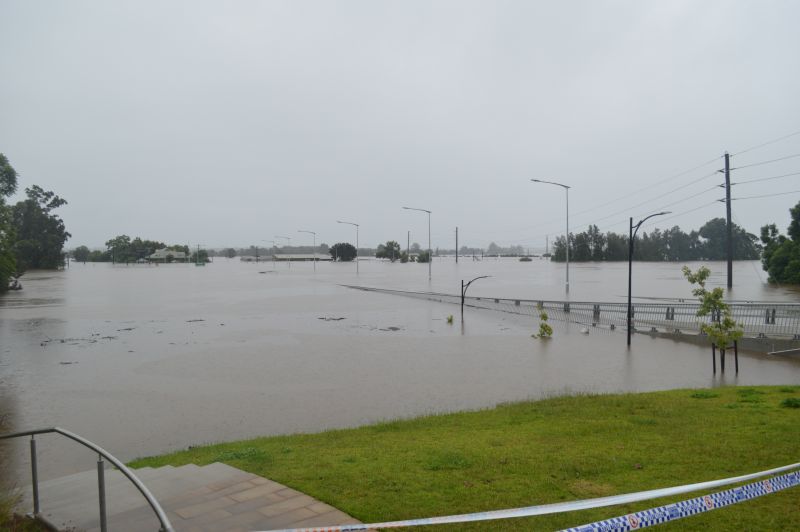
It is now exactly 12 months to the day that major flooding impacted much of the Hawkesbury River basin including Richmond and Windsor and local environs.
Return to Windsor Bridge - 12 months later
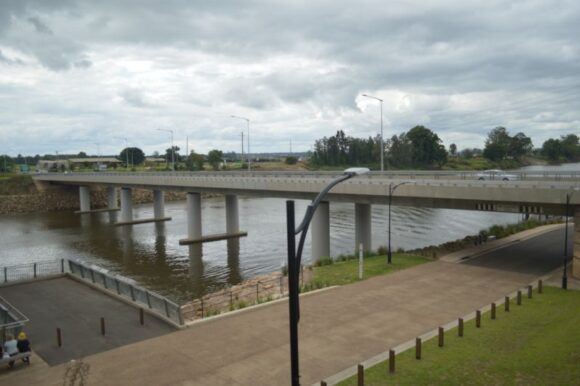
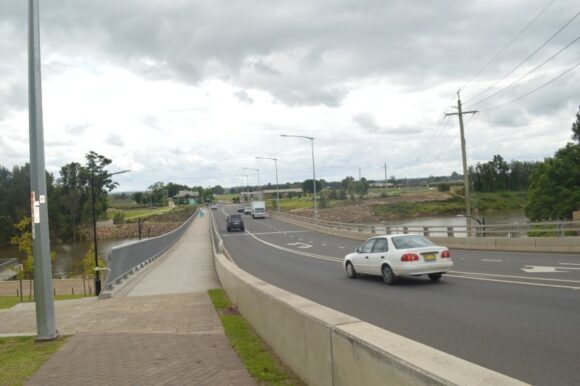
As shown one year later in the attached photos taken Saturday 4 March 2023, the Windsor Bridge is functioning normally with traffic flowing east to west and the Hawkesbury River is in a benign state.
However, evidence to the events of 12 months ago are still clearly evident including a collapse of the riverside walking track at the Windsor Town Centre which is fenced off and awaiting major repairs.
A comparison of photos is attached.
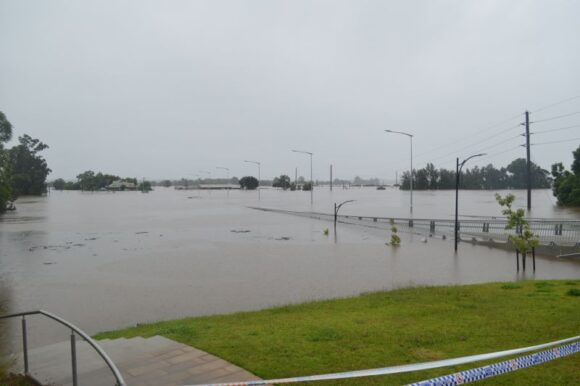
However, when compared to the events exactly twelve months ago, a different scene soon emerges and the comparison is stark.
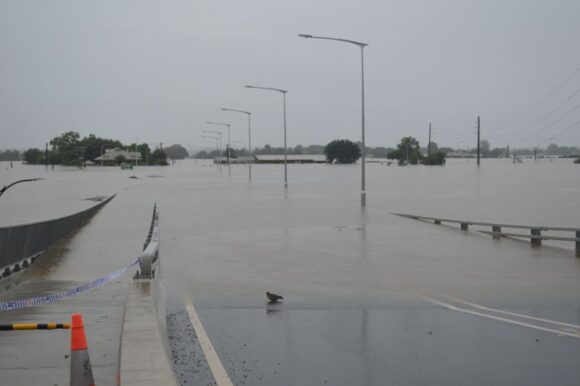
Exactly twelve months ago, the events leading up to this flood catastrophe include:
- Rainfall was recorded on 16 consecutive days between Tuesday 22 February and Wednesday 9 March 2022.
- During this period, rainfall culminated on Thursday 3 March and again on Saturday / Sunday 5 and 6 March where rainfall figures on both days reached or exceed 100 mm. During this period, rainfall totaled in the hundreds of mms across Sydney.
- There were two flood peaks being recorded during the first 10 days of March 2022.
- The year 2022 became the wettest year on record for Sydney City and March 2022 saw record monthly rainfalls including monthly totals that topped 500 to 600 mm across large parts of Sydney.
- This event coincided with the La Nina weather pattern.
At this time, the regional city of Lismore was inundated by flooding and flooding impacted other localities and towns. The flooding was a feature on TV news bulletins.
Exactly 12 months on, the floods are now a distant memory and while the La Nina still presents itself, its influence is now weakening.
The flood peak records as shown in the attached image taken at Windsor Bridge Saturday 4 March 2023 are a reminder of the floods that have occurred. This also suggests that there will be more floods in future years to come.
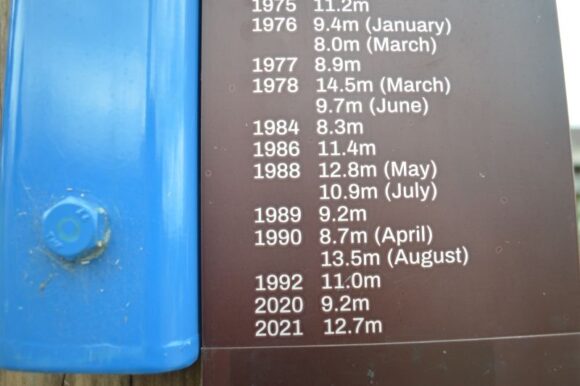
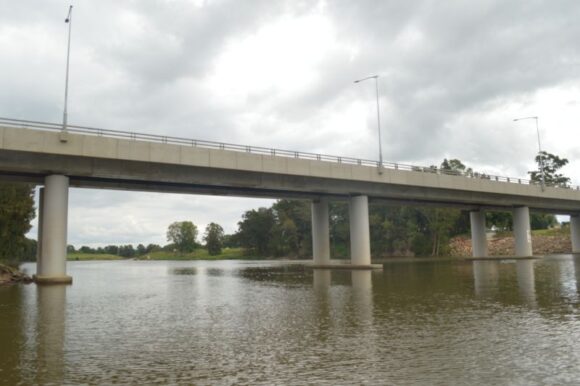
It is noted that the 2022 flood peaks have still not been recorded on the flood chart as shown stationed next to the new bridge.
The summer of 2022/2023
A comparison of the summer 2022/2023 can be made with the summer of 2021/2022 and there are notable differences emerging and it can be deduced that the events of March 2022 are less likely to be repeated for 2023.
Of interest, it is identified that rainfall across southern Australia has now been decreasing for the past 3 months and rainfall was reduced for the summer just concluded. Some samples are shown within the table below.
| City or location | Summer 2021/22
December 1 to February 28 |
Summer 2022/23 with comment
December 1 to February 28 |
| Sydney (Observatory Hill) | 655 mm. | 447.4 - Well above average but reduced by 207.6 mm.
There were still significant weather events punctuating benign weather periods producing local flash flooding events. |
| Melbourne (Botanic Gardens) | 172.4 mm. | 86.2 mm
Halved and slightly below the long term average. |
| Canberra (Airport) | 240.8 mm. | 183.4 mm
A reduction of almost 60 mm. |
| Albury / Wodonga (Airport) | 359.4 mm. | 236.6 mm - A reduction of 122.8 mm.
Still above average but much of this fell in one single event being 135 mm on Sunday 29 January 2023. |
| Where I live
Based on my rain gauge as a comparison (Not official) |
354.4 mm. | 233.4 mm - A reduction of 121 mm. |
If this exercise is completed for more towns and cites across wider regions of south east Australia, it too will show reductions in rainfall across the summer period when compared to the previous summer.
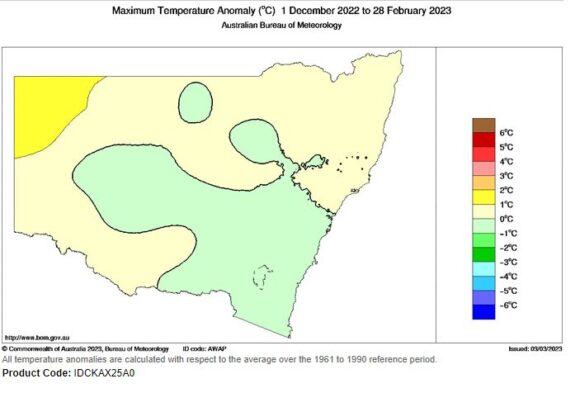
While maximum temperatures fluctuate depending on location, overall, maximum temperatures across the summer for south east Australia were still at average or below average by at least 1C.
However, it was a slightly warmer summer when compared to the summer of 2021/2022.
It is identified that while average maximum temperatures across Western Sydney were still below the long term average, it was a slightly warmer summer when compared to the previous summer.
It was also a drier summer when compared to the previous summer.
The December to February period where I live featured a slightly warmer summer than that for 2021/2022 and in particular January and February were at least 1C to 2C warmer than that for the same months for early 2022.
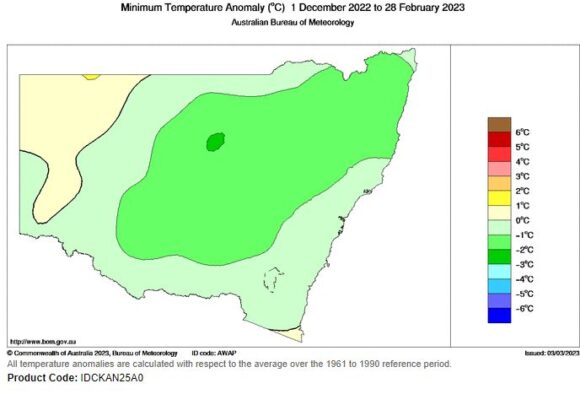
It is noted that the average temperature for December 2022 was relatively similar to that of December 2021 but it was 0.4C warmer. However, rainfall was significantly reduced.
The number of 30C days where I live for the summer 2022/23 totaled 29 days (December 1 to February 28) compared to 20 days for the previous summer (Same period).
Note: The total number for that season only reached 25 days (Includes spring to early Autumn).
The number of thunderstorms were well down and only 8 days can be recognized during the past 6 months when thunder was audible where I live or where a thunderstorm passed over. If anything, most of those were relatively weak and minor events. Generally, only one storm event could be described as reasonable being the event of Tuesday 24 January 2023. As a result, the chances of storm chases or photographs of storms was much reduced.
However, I did undertake three good storms chases during January 2023 outside Western Sydney.
Where I live, had it not been for a single 90 minute rain event of Wednesday 22 February that produced between 50 to 70 mm, February 2023, could have been a relatively dry month.
Given what is now occurring, the flood events shown in the photos taken at Windsor early March 2022 are less likely to occur for 2023. Overall, there is a difference.
Finally, it is likely that given the change to likely neutral conditions over coming months and even a possible reversal to an El Nino event, the summer of 2023/24 is likely to look very different again with warmer and drier conditions returning with more incidence of heatwave events instead of flood events.
Note
1 - The flood photos attached are taken at Windsor on Tuesday 8 March 2022 during the second flood peak.
2 - The photos showing a benign Hawkesbury River and Windsor bridge as a comparison 12 months after the event are taken during the afternoon of Saturday 4 March 2023 generally at the same locations.
