During the period, much of South East Queensland has endured some very heavy rainfall leading to flooding of local rivers and roads and it is now known that there are three fatalities possibly as a result of the driver of the car driving into flooded low lying areas.
An east coast low is responsible for the deluge that has affected areas south of Maryborough, the Sunshine Coast, Brisbane and the Gold Coast. In addition, the Lockyer Valley and Toowoomba have also been affected by heavy rain.
Local rivers are in flood and major flooding is occurring at Boonah (Teviot BK) and Oxley Creek Goodna as examples. There are other areas affected as well.
The worst of the rain and flooding occurred during Friday 1 May where some incredible rainfalls have been recorded such as:-
Brisbane metropolitan area
Kallaorgur Alert - 291 mm.
Lipscombe Road Alert - 273 mm.
Bracken Ridge Alert - 269 mm.
Lawnton Alert - 262 mm.
Brisbane City - 188 mm.
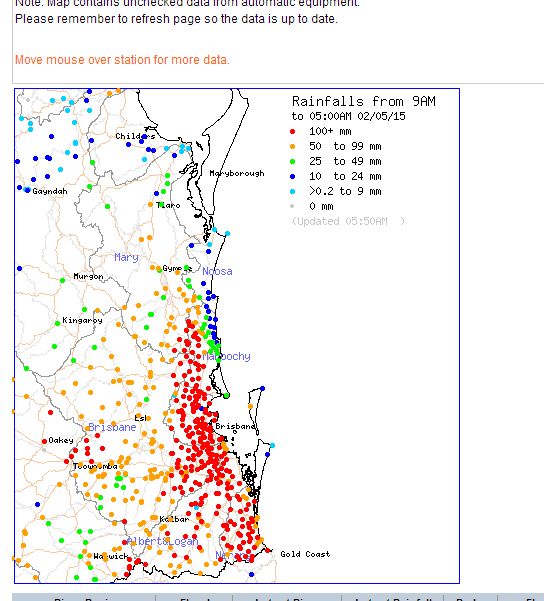
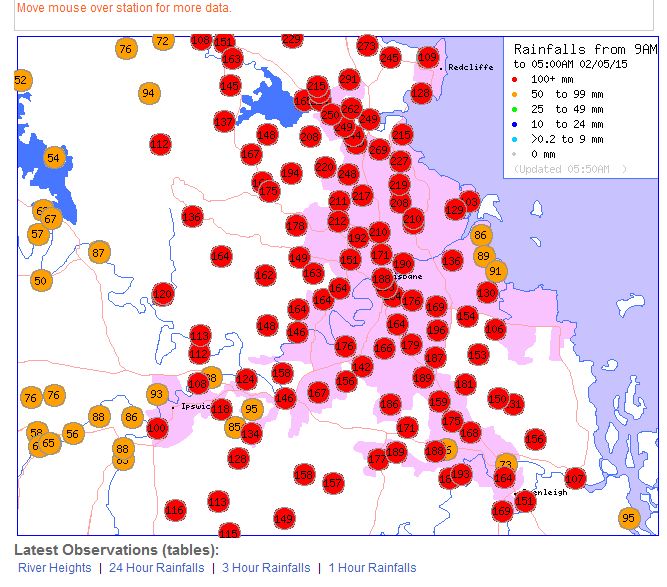
The rainfall plot for Brisbane to 5 am Saturday morning is astounding especially across the north east region.
These are major totals for May but even these are surpassed by what has occurred further north around the Sunshine Coast as follows:-
Caboolture Bruce Highway - 333 mm.
Caboolture Short Street - 327 mm.
Caboolture (Bribie Island Road) - 311 mm.
Elimbah Alert - 306 mm.
Sheep Station Creek Alert - 306 mm.
Rose Creek Road Alert - 303 mm.
Beachmere - 296 mm.
Burpengary - 274 mm.
Judds Road Alert - 268 mm.
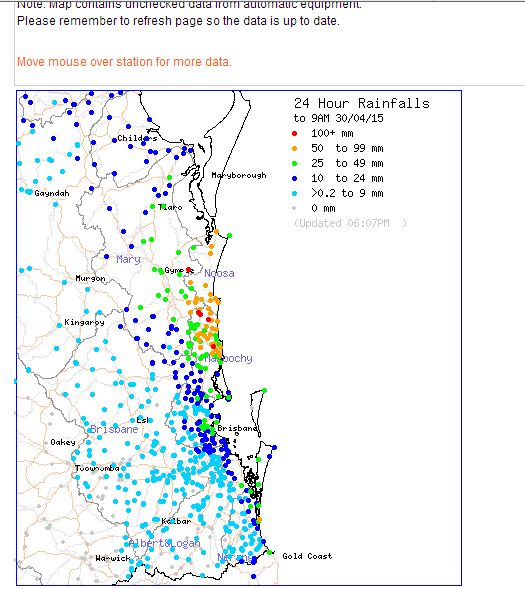
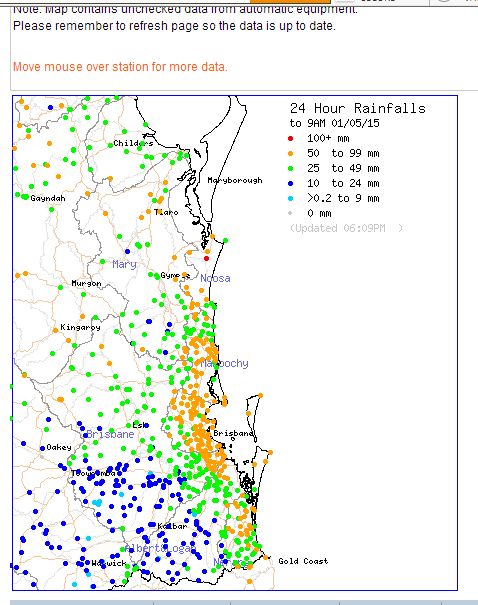
These are amongst the highest but there are too many to report. The figures are to 5 am 2 May. I have provided plots for the 30 April, 1 May and 2 May 2015 and when added, it becomes clear a major event has occurred that has caused chaos resulting in a major clean up when flood waters recede.
This comes a week after the New South Wales Sydney and Central Coast / Hunter Valley event that when last checked, insurance claims have topped $200 million. It is likely that this event will create a second major insurance payout when jobs are complete.
Please post any photos of the event to this post.
As an addendum, to the above statement, there are rivers that have gone into flood. There is major flooding on at last three rivers and many more in moderate flood. As an example, two rivers have been chosen and river level graphs have been generated for two locations being 1 – Boonah and 2 – Oxley Creek.
The rain of Friday has caused quite sudden river rises at both locations.
http://www.extremestorms.com.au/south-east-queensland-rain-and-flooding-30-april-to-may-2-2015/ South east Queensland is now facing a flood crises following some exceptional rainfall throughout Friday. This is the second big rain and flood event to strike the east coast of Australia in a space of 2 weeks.
http://www.extremestorms.com.au/south-east-queensland-rain-and-flooding-30-april-to-may-2-2015/ South east Queensland is now facing a flood crises following some exceptional rainfall throughout Friday. This is the second big rain and flood event to strike the east coast of Australia in a space of 2 weeks.
http://www.extremestorms.com.au/south-east-queensland-rain-and-flooding-30-april-to-may-2-2015/ South east Queensland is now facing a flood crises following some exceptional rainfall throughout Friday. This is the second big rain and flood event to strike the east coast of Australia in a space of 2 weeks.
http://www.extremestorms.com.au/south-east-queensland-rain-and-flooding-30-april-to-may-2-2015/ South east Queensland is now facing a flood crises following some exceptional rainfall throughout Friday. This is the second big rain and flood event to strike the east coast of Australia in a space of 2 weeks.
To provide some perspective to the event, I have downloaded two images from a satellite operated by NASA (National Aeronautics Space Administration) showing the cloud cover over south east Queensland causing the event. Taken from RAPID Response Modis (Aust 6 Subset) as the satellite passed over South East Queensland. The second one is high resolution.
Its clearly shows the storm in perspective.
I know an east coast low was to form and produce heavy rainfall but not of this intensity! And is such short duration! And yes 2 events within a 2 week period is catastrophic!
I know an east coast low was to form and produce heavy rainfall but not of this intensity! And is such short duration! And yes 2 events within a 2 week period is catastrophic!
I know an east coast low was to form and produce heavy rainfall but not of this intensity! And is such short duration! And yes 2 events within a 2 week period is catastrophic!
The death toll from this event has now risen to five. In addition it is known that SES personnel have carried out 30 rescues plus more than 1,800 calls for help. The fatalities are a result of drownings or people driving into flood waters.
The death toll from this event has now risen to five. In addition it is known that SES personnel have carried out 30 rescues plus more than 1,800 calls for help. The fatalities are a result of drownings or people driving into flood waters.
The death toll from this event has now risen to five. In addition it is known that SES personnel have carried out 30 rescues plus more than 1,800 calls for help. The fatalities are a result of drownings or people driving into flood waters.
The highest wind gust observed from this event was a single wind gust of 108 km/h at Moreton Island Weather Station at 3.43 pm. In addition and during the worst of the storm, some 30,000 homes were blacked out with approximately 4,000 calls for assistance / help with some 2,200 calls to SES. Despite the large number, the east coast low is not as strong as the first one but it was still an efficient rain producing system.
The highest wind gust observed from this event was a single wind gust of 108 km/h at Moreton Island Weather Station at 3.43 pm. In addition and during the worst of the storm, some 30,000 homes were blacked out with approximately 4,000 calls for assistance / help with some 2,200 calls to SES. Despite the large number, the east coast low is not as strong as the first one but it was still an efficient rain producing system.
The highest wind gust observed from this event was a single wind gust of 108 km/h at Moreton Island Weather Station at 3.43 pm. In addition and during the worst of the storm, some 30,000 homes were blacked out with approximately 4,000 calls for assistance / help with some 2,200 calls to SES. Despite the large number, the east coast low is not as strong as the first one but it was still an efficient rain producing system.
The highest wind gust observed from this event was a single wind gust of 108 km/h at Moreton Island Weather Station at 3.43 pm. In addition and during the worst of the storm, some 30,000 homes were blacked out with approximately 4,000 calls for assistance / help with some 2,200 calls to SES. Despite the large number, the east coast low is not as strong as the first one but it was still an efficient rain producing system.
The attached plot for Queensland shows the rainfall for the week ending 3 May 2015. It is clearly shown that south east Queensland is worst affected with an area around Brisbane and north to the Sunshine Coast receiving between 200 and 300 mm. It is known that some falls exceeded 300 mm but probably too small to display on the plot.
Conditions have now moderated which allows a clean up to commence.