

One of the worst flood events in many years struck the regions of Newcastle and Hunter Valley, Sydney and parts of Wollongong during the period 20th to 23rd April 2015 caused by a localised and very intense east coast low pressure system.
The following are summaries taken from various news stories throughout the week illustrating its impact:-
1 – Damage bill. Still rising. As at 10 am 23/5/15, insurance companies had received 24,250 claims with the damage bill soaring to and beyond $161 million. This event is likely to cost in the hundreds of millions once all jobs are complete.
2 – Death toll. Normally I do not talk about death tolls on this forum however, given the intensity of the event, it is appropriate that this be considered. There are 8 known fatalities from car accidents to drownings.
3 – 12 declared disaster areas being Cessnock, Dungog, Gosford, Great Lakes, Lake Macquarie, Maitland, Newcastle, Pittwater, Port Stephens, Singleton, Warringah and Wyong Council areas.
4 – Some 132 flood related rescues including 95 rescues in the Hunter Valley.
5 – Incredible as it sounds, New South Wales Fire Brigade attended some 100 fires during the event.
6 – Up to 80 sets of traffic lights around Sydney blacked out and 90 sets of traffic lights blacked out around Newcastle.
7 – Up to 14,860 requests for help including 5,000 such requests in the Hunter Valley. The Hunter Valley is by far the worst hit region.
8 – Up to 200,000 homes without power on Wednesday evening. Figures are varying depending on what source is being used. For example another source suggests 225,000 homes without power with Ausgrid suggesting 130,000 customers affected around Newcastle and the Hunter Valley, 80,000 on the Central Coast and 15,000 across Sydney.
9 – Highest known rainfall as a cumulative total is 454 mm at Belmore Bridge (Maitland).
10 – Highest wind gust is around 135 km/h at Wattamolla and Nobbys Head (Newcastle).
11 – By 4.30 pm 24/4/2015, power had been restored to some 120,000 customers.
The above shows some of the impacts and misery that this event has had. With so many jobs, this will take some time to clear and repair.
In relation to this matter, I had noticed that the landslip on Woodville Road (Granville) as at late Friday had not been repaired with one northbound lane closed. This is just one of many jobs for SES and repair crews to work on over coming days and weeks.
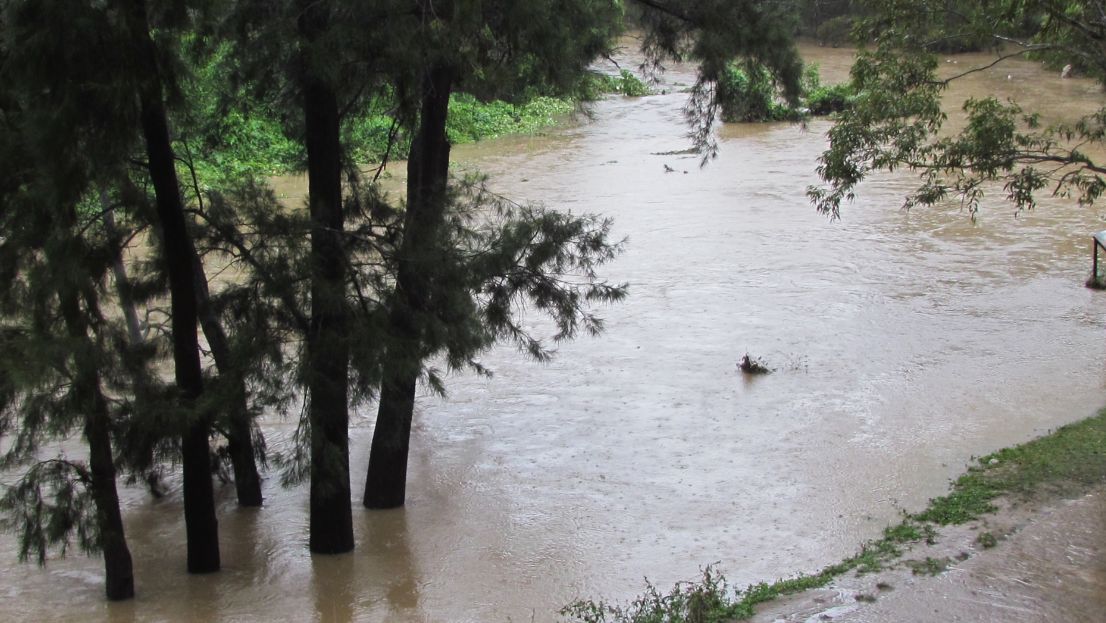
The photo attached to this post is my one taken at Duck River in flood. I have also generated a cumulative rainfall plot for Sydney on a little known section of the “Water and the Land”, Bureau of Meteorology website for Sydney accounting for the event. The figures are impressive as shown.
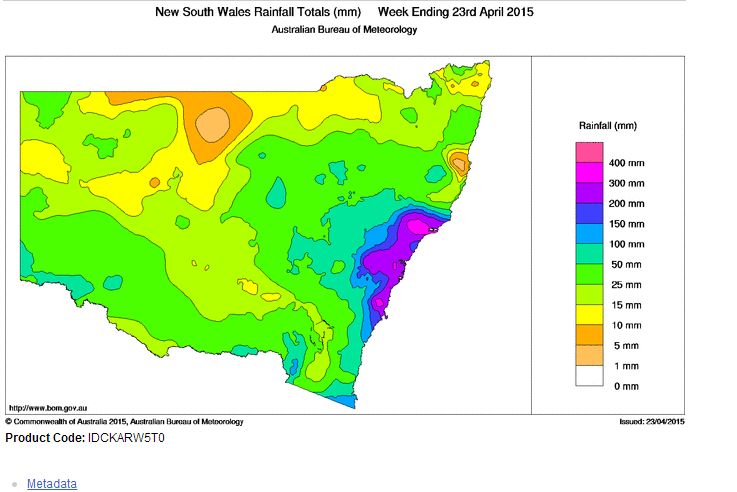
I have also generated a rainfall plot for New South Wales for the week ending 23/4/2015 “Water and the Land” which clearly shows the event around Newcastle, Sydney and Wollongong.
When combined, this shows the magnitude and scale of the event and it is being declared a natural disaster.
CUMULATIVE RAINFALLS FOR SYDNEY
These are impressive for the period and they include:-
Cherrybrook – 349.2 mm.
Hornsby – 349 mm.
Wahroonga – 346.4 mm.
Turramurra – 336.2 mm.
Baulkham Hills – 310 mm.
North Parramatta – 309 mm.
Sydney Olympic Park – 298 mm.
Sydney Botanic Gardens – 296.4 mm.
Chatswood Bowling Club – 286 mm.
Blacktown and Strathfield – 282 mm.
Sydney Observatory Hill – 271.8 mm.
Randwick – 270 mm.
Sydney Airport (Mascot) – 252 mm.
Some of these are not on the plot provided above. Generally, no one missed out and as such the impact of the event is widespread.
HUNTER VALLEY – CUMULATIVE RAINFALL
Belmore Bridge – 454.5 mm.
Branxton – 368 mm.
Williamtown RAAF base – 291.6 mm.
Wyong (Kangy Angy) – 291 mm.
ILLAWARRA – CUMULATIVE RAINFALL
Robertson – 398.6 mm.
Robertson (The pie shop) – 349.8 mm.
Beaumont (The Cedars) – 354 mm.
Kangaroo Valley – 332.8 mm.
I attach the plot cumulative plot which I have generated from Water and the Land.
Looking at these figures and others, it soon becomes clear why the damage is so high and widespread. Please feel free to add to this post regarding the aftermath.
It was one devastating event – one can only imagine the final repair bill.
It was one devastating event – one can only imagine the final repair bill.