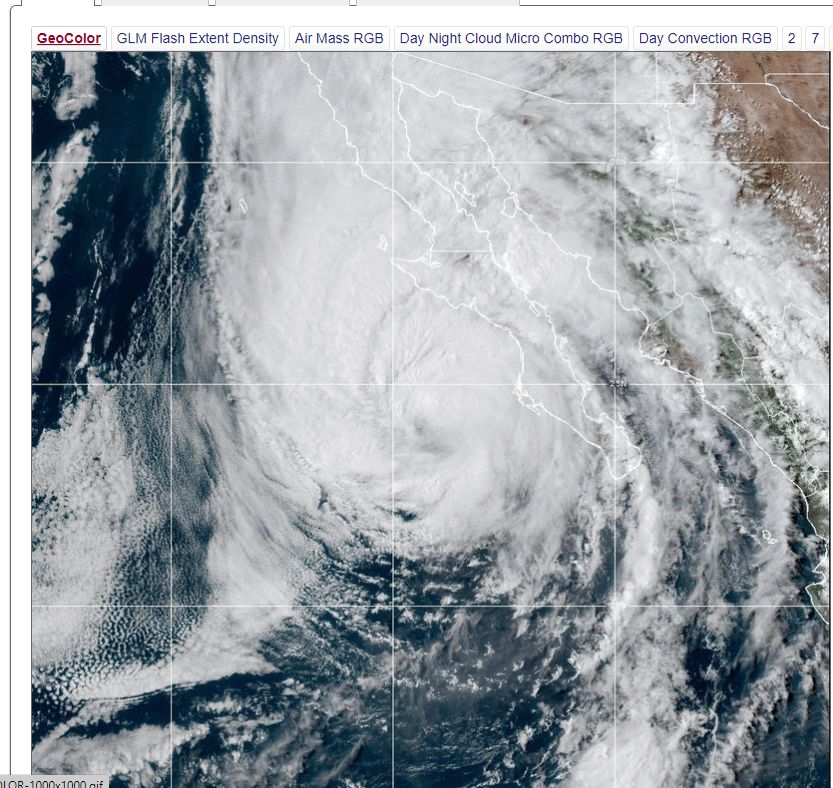
A remarkable storm and weather event has impacted southern California over recent days. Extensive rainfall has resulted in rare flash floods across desert regions of the state.
While such storms have occurred in the past, this event was unique given the sequence of events that took place. The key points to this event are:
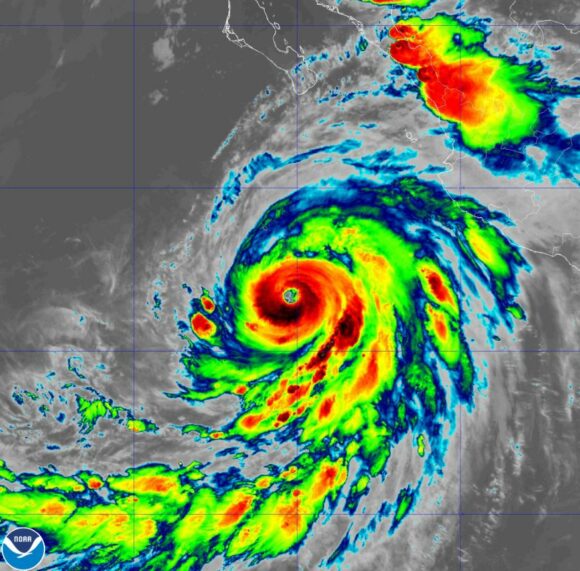
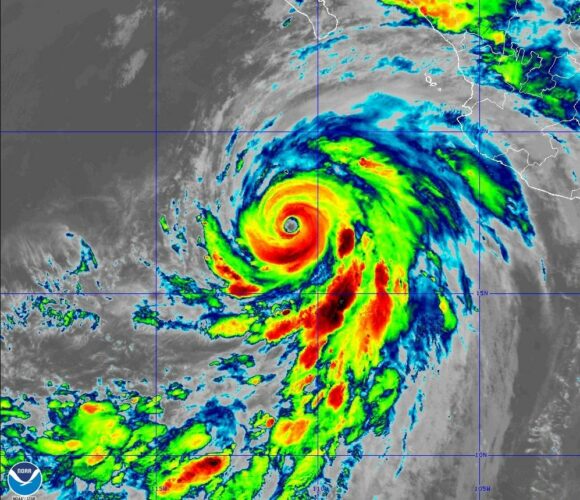
- A Hurricane formed well out to sea off the west coast of Mexico and rapidly intensified into a Category 4 storm on the Saffir Simpson Scale. The storm was named Hilary.
- At peak intensity, the storm had peak wind gusts of up to 230 km per hour at the core.
- The storm moved north west and parallel to the Mexican coast then made landfall across Baja California.
- The storm weakened rapidly to a tropical storm as it approached Baja California.
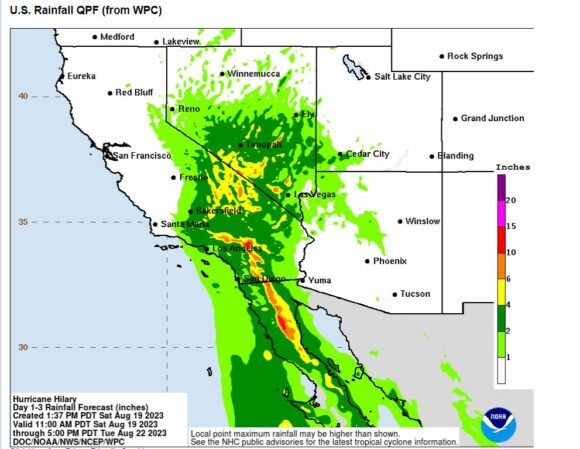
- The storm has dropped considerable rainfall especially within the mountains east of San Diego and Los Angeles.
- Such rains even reached Death Valley in California but places further east and north received little or no rainfall.
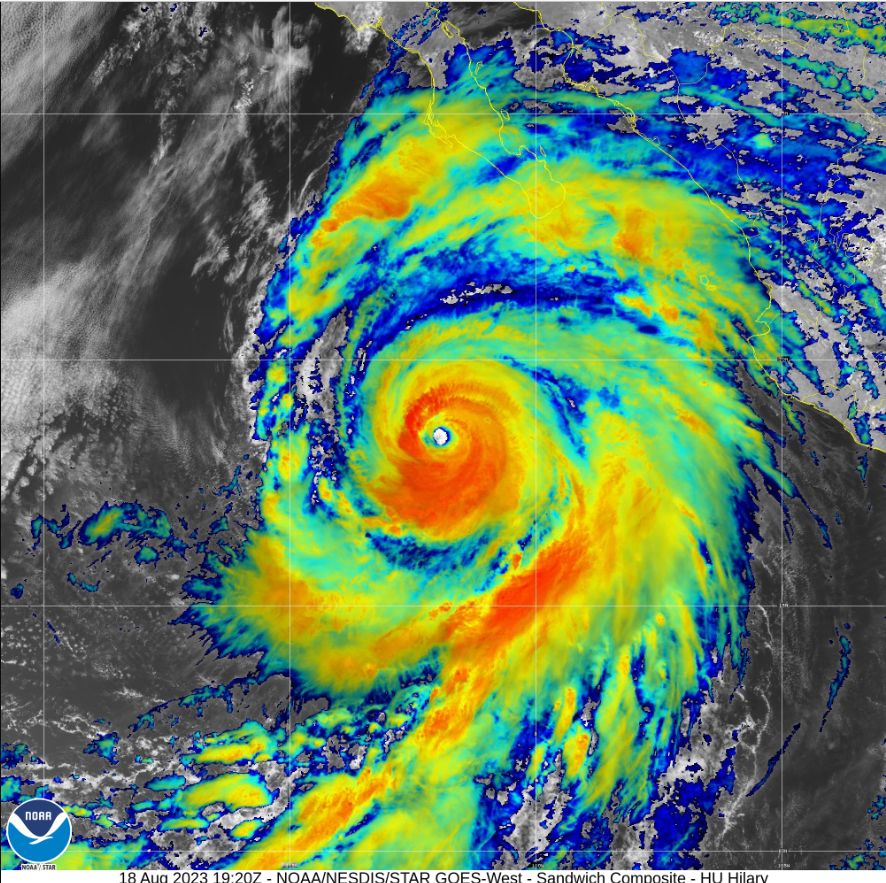
The oceans off the west coast of Mexico often favour the development of Hurricanes given that oceanic temperatures are often at least 30C or higher. Hurricane Hilary formed like any other hurricane within this area but instead of traveling west as most would, the storm took a more northerly path and reached peak intensity during a 24 hour period between 4 pm August 18 and 4 pm August 19.
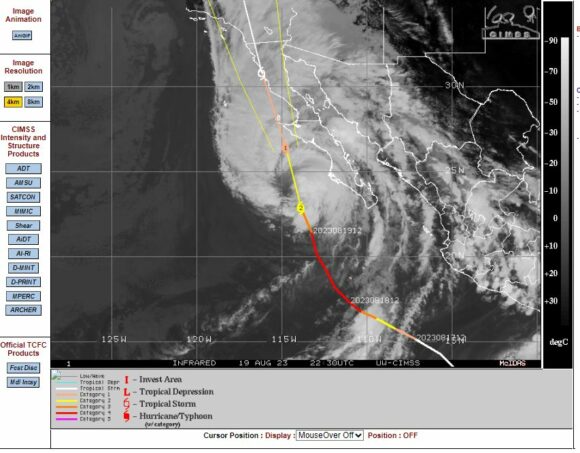
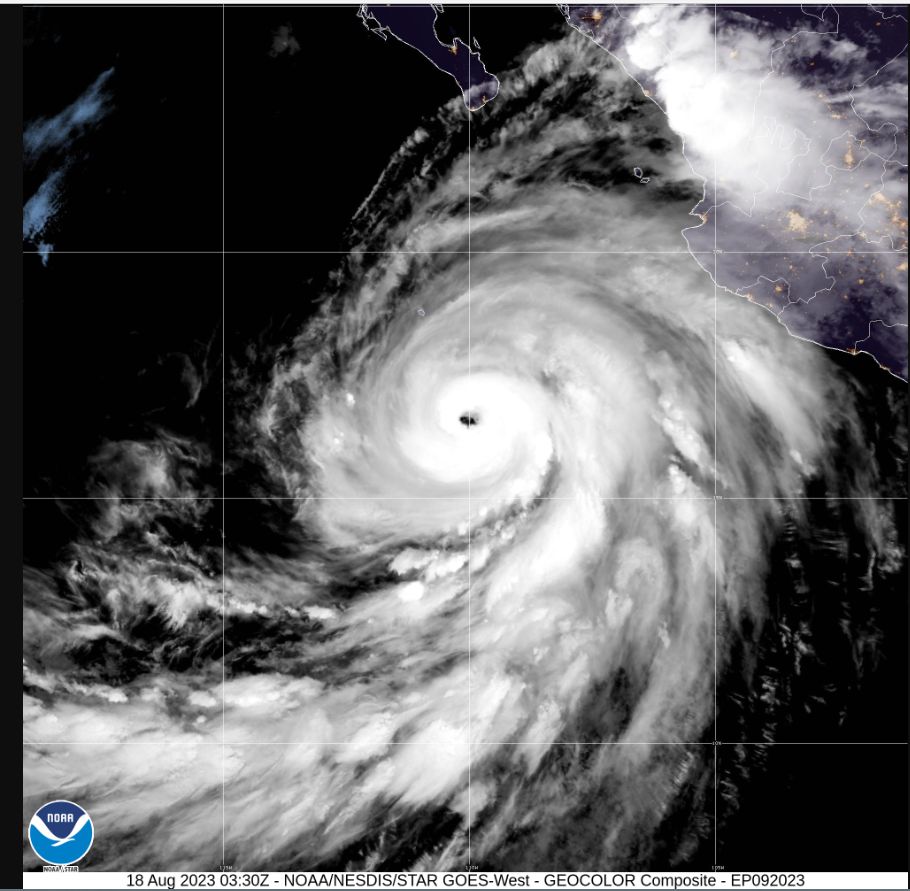
During this time as per the CIMSS model attached, the storm had reached Category 4 on the Saffir Simpson Scale and sustaining peak wind gusts of up to 230 km/h at the core.
Once the storm approached Baja California, it encountered much colder waters (Under 25C) and the storm went into rapid decline.
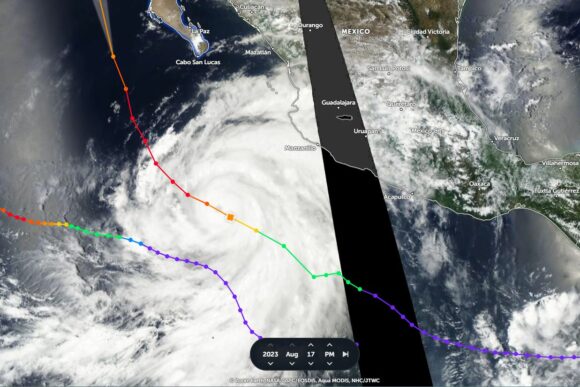
Given the speed of the storm, a rare tropical storm warning was issued for the San Diego and Los Angeles city regions. The National Weather Service issued multiple warnings for the regions for heavy rainfall and even for flooding. In particular:
- Warnings were issued for slight to high risk of excessive rainfall.
- Warnings were issued for flash floods and landslides primarily across mountainous areas and canyons.
The west coast of California around San Diego and Los Angeles is rugged with mountain ranges inland from a coastal plan. Mountains do reach and exceed 3,000 metres in height such as at Mt San Antonio (North east of Los Angeles) at 3,068 metres in elevation.
Areas to the east of the mountains are desert regions where a semi arid to arid climate prevails. There are numerous steep canyons across the region. The primary concern was that the mountains, steep slopes and terrain would contribute to dangerous flash floods within valleys. It was determined that the heaviest rainfall would fall across the higher mountains.
The storm had dramatic impacts across the region and as expected, the heaviest rainfall occurred within the higher mountains. The storm brought unusual rainfall to San Diego and Los Angeles with falls of 40 to 60 mm common. This is significant for August given that the month is almost always dry for both cities.
The 2 day rainfall tally to 4.47 am Monday 21 August 2023 (Local time)
A weather station at Mt San Jacinto recorded 11.74 inches of rain converted to 298.2 mm (Elevation 2,584 metres).
Other major totals include:
- Raywood Flats - 11.73 inches converted to 298 mm (Elevation 2,129 metres).
- Mt Laguna - 7.11 inches converted to 180.6 mm (Elevation 1,830 metres).
San Deigo County - Coastal areas
1.41 inches to 2.66 inches converted to 35.8 mm to 67.5 mm.
San Deigo County - Valley areas
1.56 inches to 3.52 inches converted to 39.6 mm to 89.4 mm.
San Deigo County - Mountains
1.2 inches to 7.38 inches converted to 30.48 mm to 187.4 mm. Heavier falls occurred at higher elevations.
San Deigo County - Deserts (Western areas were the wettest).
1.55 inches to 2.25 inches converted to 39.4 mm to 57 mm.
Orange County
1.57 inches to 3.07 inches converted to 39.8 mm to 78 mm.
Santa Ana - Mountains
2.01 inches to 4.53 inches converted to 51 mm to 115 mm.
San Bernadino County - Mountains
2.54 inches to 11.73 inches converted to 64.5 mm to 298 mm.
Death Valley California
Death Valley is renowned for its heat rather than rainfall. Enough moisture and cloud penetrated into Death Valley during the 20 August to deliver some interesting rainfall totals. The Furnace Creek Weather Station recorded 42.6 mm from this event during two rain bursts. This is almost the entire yearly rainfall for that location.
Heavier rain fell within the mountains and flash floods occurred at Death Valley Junction and Armagosa Valley.
It is identified that the rain could not penetrate much further inland and cities like Las Vegas received only light falls.
Towns and cities such as Barstow and Havasu City received barely anything due to how the mountains influenced rainfall further west.
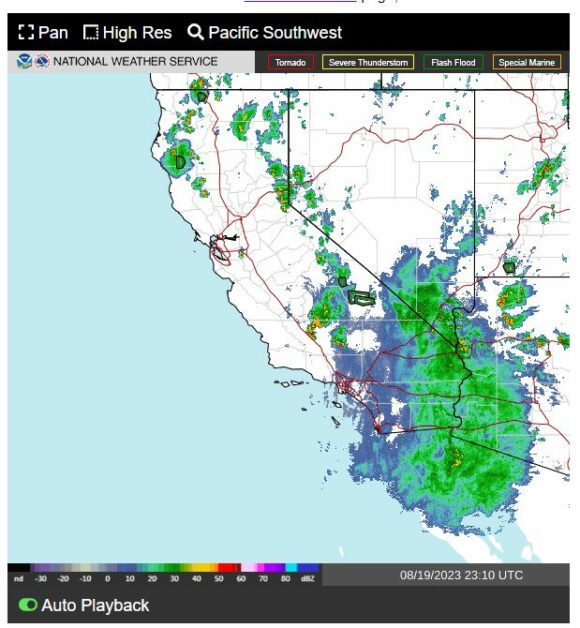
Attached to the post are various plots, radar images, satellite images of the storm taken from the National Weather Services and CIMSS forecast models at the time showing the storm in more detail.
Source
1 - National Weather Service (Various radar images and satellite photos of the storm).
2 - CIMSS (Forecast Model of the storm).
3 - NASA - Satellite images of the storm.
