Sydney Observation Hill - The 5th wettest year since weather records commenced.
Sydney Observatory Hill has exceeded 2,000 mm of rain for 2022. When reviewing rainfall records since records commenced all the way through to 2022, it is identified that this is the shortest period of time (8 months) in which 2,000 mm of rain has fallen in any given year.
As at August 31 2022, 2,010.6 mm of rain had fallen in 8 months. The weather station only needs another 183.4 mm of rain to set a new rainfall record.
Given that the figures do not include the current rainfall and with 4 months to go to the end of the year, it does look increasingly likely that a new rainfall record will be set for the weather station.
The wettest 5 years for Sydney are:
- 1950 2,194 mm.
- 1860 2,110.5 mm.
- 1890 2,071.1 mm.
- 1963 2,035.6 mm.
- 2022 2,010.6 mm (To August 31). Note - The weather station has recorded 24.6 mm of rain for the first four days of September. Observatory Hill is now on the cusp of recording the fourth wettest year since records commenced and overtaking the wet year of 1963.
- Driest year 1888 on 583 mm (As a comparison).
Prospect Reservoir Records
There are solid records at Prospect Reservoir dating back to 1887. The wettest year recorded is 1950 with 1,900 mm falling. Given the rainfall that has fallen for 2022, it is likely that the figure will be approached but not exceeded. Notwithstanding this, 2022 will still finish up as being a very wet year.
Significant rain events for August 2022
August 2022 along coastal New South Wales was significantly drier than that of July but it was still damp. Inland, rainfall was above average due to several weather systems and rain events occurring.
There were significant rain events on the 5 and 6 August and 12 to the 17 August in which falls of 25 mm to 50 mm were common across the ranges and North West slopes of New South Wales.
Strong cold front 23 August 2022
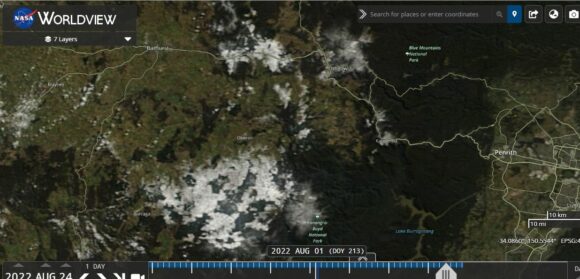
There was also a strong cold front on the 23 August which brought low level snow including snow across the Central Tablelands near Bathurst, at Oberon and around Katoomba. The snow was so significant that the Great Western Highway at Mt Victoria had to be closed for several hours.
Attached is the NASA worldview image of the Central Tablelands shortly after the event showing snow on the ground east of Bathurst, south of Oberon at around Katoomba and Mt Victoria.
This event was significant for Sydney as one particular rain shower that passed over Western Sydney brought the first thunderclaps (2 heard at Auburn) since March 7. As such, this ended a thunderstorm drought that had lasted for 169 days.
The event resulted in a sharp drop in temperatures across Sydney from 20C to 22C at 11.30 am to 7 to 9C by 4 pm and rainfall of 11 to 21 mm that was evenly spread across the city.
In many years, August is a month in which the first warm days of the spring / summer occur but such warmth was less likely to occur for August 2022 across Sydney. The warmest days were the 3 and the 30 in which maximum temperatures reached 23C to 25C but such warmth was short lived.
First storms / supercells for the season
The first thunderstorms of the new season have occurred including those that passed through the Sydney region on August 23. A particular storm cell did produce small hail as it passed over suburbs to the south of the city.
However, this was minor compared to the major storms that impacted parts of western and north west Victoria during the afternoon of Monday 29 August 2022. A few of the storms developed into supercells that brought hail to golf ball size.
A major storm passed over the town of Horsham that brought damaging wind gusts to 100 km/h between 3.05 pm and 3.12 pm and 8.4 mm of rain between 3.05 pm and 3.10 pm (Being 1.6 mm per minute).
Another major storm dropped 20 mm of rain over Mildura.
Such major storms / supercells are quite rare for north west Victoria but the event of the 29 August demonstrates that significant storm events can and do impact this part of the state.
Rainfall for August
As shown in the table below which is updated from the table of July 2022 for the same New South Wales localities, rainfall across coastal centres is impressive.
Already, there are weather stations and towns including Sydney Observatory Hill that have received more than 2,000 mm for the January to July period.
| SYDNEY REGION | August 2022 | So far for 2022 |
| Parramatta | 32.6 mm on 11 days. | 1,568 mm. |
| Penrith | 20.2 mm on 8 days. | 1,387.2 mm. |
| Richmond | 24.6 mm on 9 days. | 1,237.4 mm. |
| Sydney (Observatory Hill) | 59.2 mm on 13 days. | 2,010.6 mm. |
| Home (Comparison and guide only) | 26.8 mm on 9 days. | 1,415 mm.
It is calculated that rain has fallen on 118 days throughout the 8 months of 2022 to August 31 resulting in 48.5% of days being wet at some stage. |
| NORTH COAST NSW | ||
| Ballina | 42.4 mm on 13 days. | 2,279.8 mm |
| Coffs Harbour | 21.4 mm on 8 days | 2,106.2 mm |
| Dorrigo | 33.8 mm on 8 days. | 2,306.3 mm |
| Grafton | 31 mm on 12 days. | 1,232.2 mm |
| Port Macquarie | 27.8 mm on 10 days | 1,942.8 mm |
| WHEAT SHEEP BELT NSW | ||
| Albury Airport | 110 mm on 18 days | 708.6 mm |
| Dubbo | 112.2 mm on 17 days | 678 mm |
| Forbes | 97.6 mm on 19 days | 568.6 mm |
| Tamworth | 80.4 mm on 13 days | 495 mm |
| Wagga Wagga | 79 mm on 23 days | 431.2 mm |
It is known that the rainfall at many inland centres has already been exceeded for a typical year eg Albury - The yearly rainfall is now 14% above the yearly average as at August 31.
During the month, some computer weather models used in other countries have declared a La Nina episode in play but the Bureau of Meteorology has resisted making such a declaration for 2022/23 to date.
Early September Rainfall (Queensland)
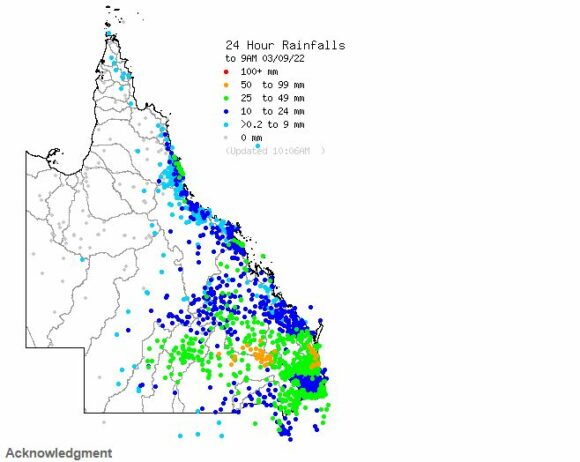
There has since been a rainfall event across large parts of inland southern Queensland that has brought widespread 25 to 50 mm falls with isolated totals topping 60 to 70 mm including 64 mm at Barakula Forest Station Alert, 65 mm at Horse Creek Alert and 67 mm at Pinelands (All figures at 9 am Saturday 3 September 2022).
Early September Rainfall (New South Wales)
The same event has brought widespread falls across north east New South Wales including 70 mm at Meldrum, 68 mm at Barrington Tops and 51 mm at Bellingen. (All figures at 9 am Saturday 3 September 2022).
There has since been a fall of 119 mm at Comboyne Public School and 142 mm at Meldrum on the New South Wales North Coast for the 24 hours to 9 am Sunday morning.
The above suggests that higher than normal rainfall will continue into spring.
Discussion Water and the Land Plots
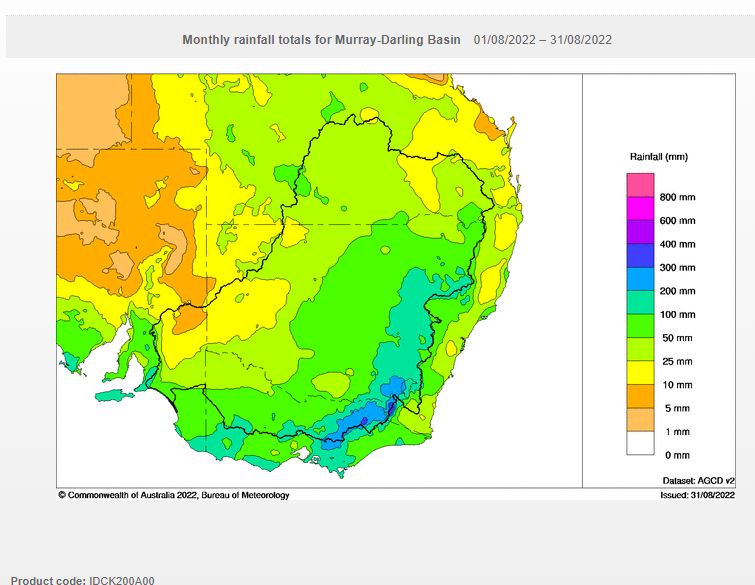
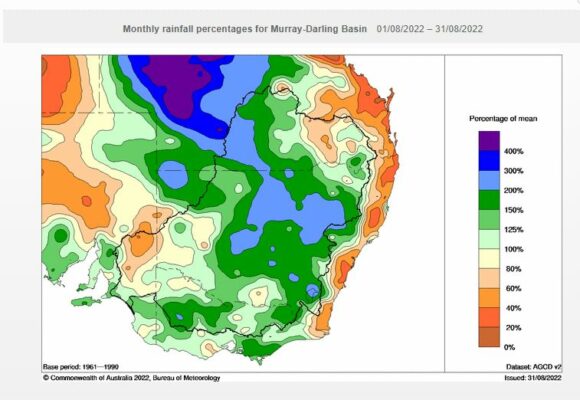
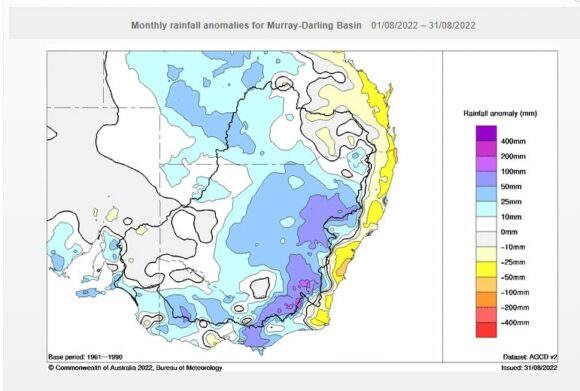
Attached are relevant Water and the Land Plots showing the rainfall for August 2022 to reinforce the discussion above. In particular:
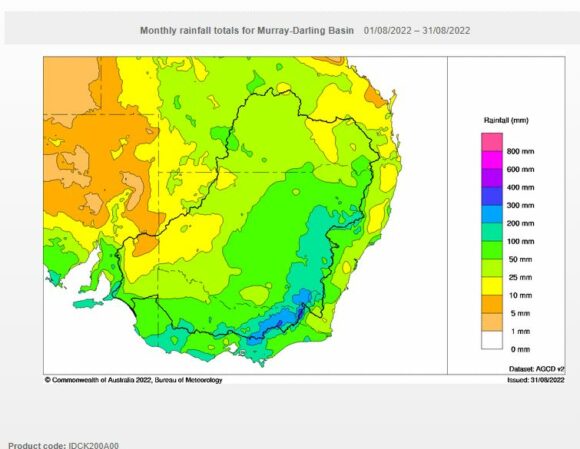
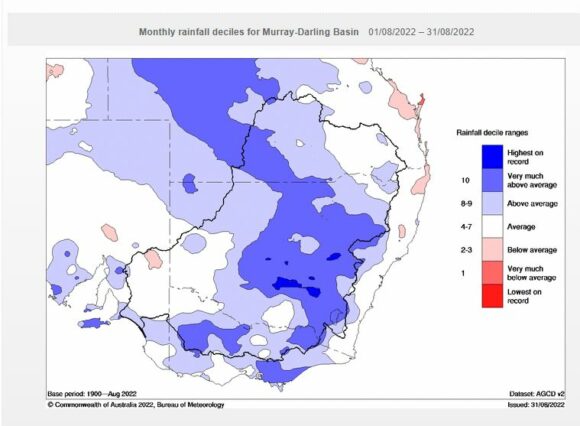
- The heaviest rain fell across the ranges and adjacent western slopes while coastal regions were much drier.
- Rainfall was above average across the inland eastern areas of Australia but tended towards average for coastal areas.
Notes
1 - All rainfall and historical rainfall used is sourced from BOM historic data and data from official weather stations.
2 - While I have a rain gauge set up in the rear yard, it is only being used as a guide but it is noted that it is relatively consistent with official figures occurring at nearby Prospect and Horsley Park where official weather stations are established.
