

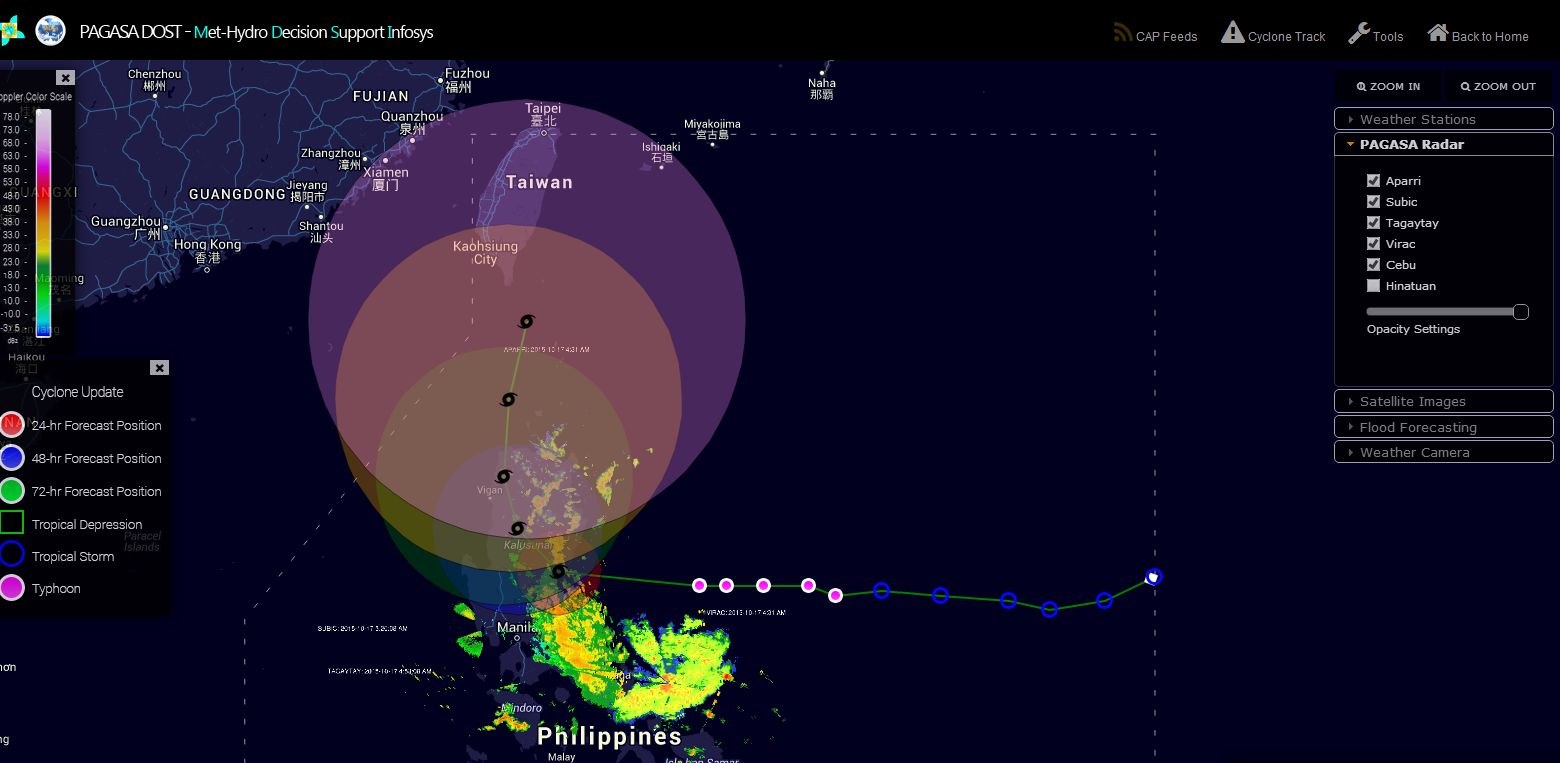
Typhoon Koppu (Lando) is slowly making its way towards northern Luzon Island with expected landfall across Northern Aurora, Quirino and Isabella.
At 3 am 17/10/15 Philippine Standard Time, the storm was located at latitude 15.7 degrees north and 124.9 degrees east and 360 km east of Baler, Aurora. It is moving west at 15 km/h according to PAGASA.
Within 24 hours, the storm is expected to be in the vicinity of Maddela Quirino and within 48 hours, the storm is expected to be within the vicinity of Carasi, Llocos, and Norte. Within 72 hours, the storm is expected to be located 165 km north west of Calayan, Cagayan.
All models show landfall over northern Luzon Island as a powerful storm capable of causing significant disruption. PAGASA is warning of the following impacts:-
1 – Forecast winds of 121 km/h to 170 km/h with heavy damage to high risk structures, moderate damage to medium risk structures and light damage to low risk structures and increasing damage to old dilapidated residential structures and houses of light materials.
2 – Widespread disruption of power, almost all banana plants down and big trees uprooted.
The most significant warnings are centred on Northern Aurora, Quirino and Isabela regions.
Winds are now estimated at 150 km/h with gusts to 185 km/h at the core and CIMSS is forecasting the possibility of this storm being although briefly, a category 4 typhoon just before landfall with winds of 115 knots or approximately 213 km/h.
Storm surges are also being forecast at coastal locations including wave heights of 4.1 metres to 14 metres.
The typhoon is now transitioning from a Category 2 typhoon to a category 3 typhoon and the PAGASA radar network at Aparri, Subic, Tagaytay and Virac is showing the outer rain bands sweeping across eastern and northern Luzon Island with the core still out to sea.
This is potentially a damaging weather system due to its size and strength and there are threats of flooding and mudslides and forecasts are being made of heavy rain with as much as 600 mm in some locations.
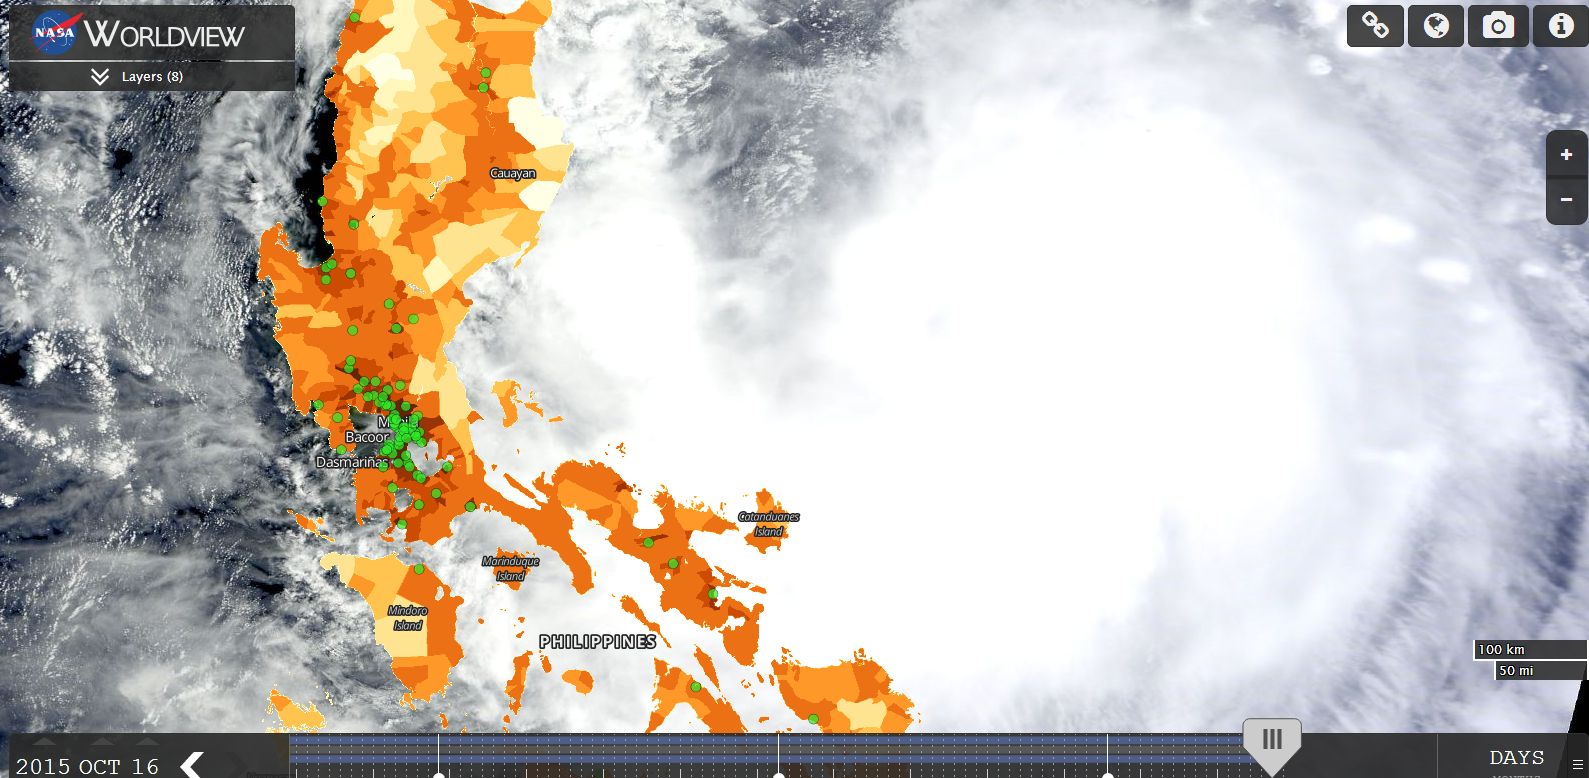
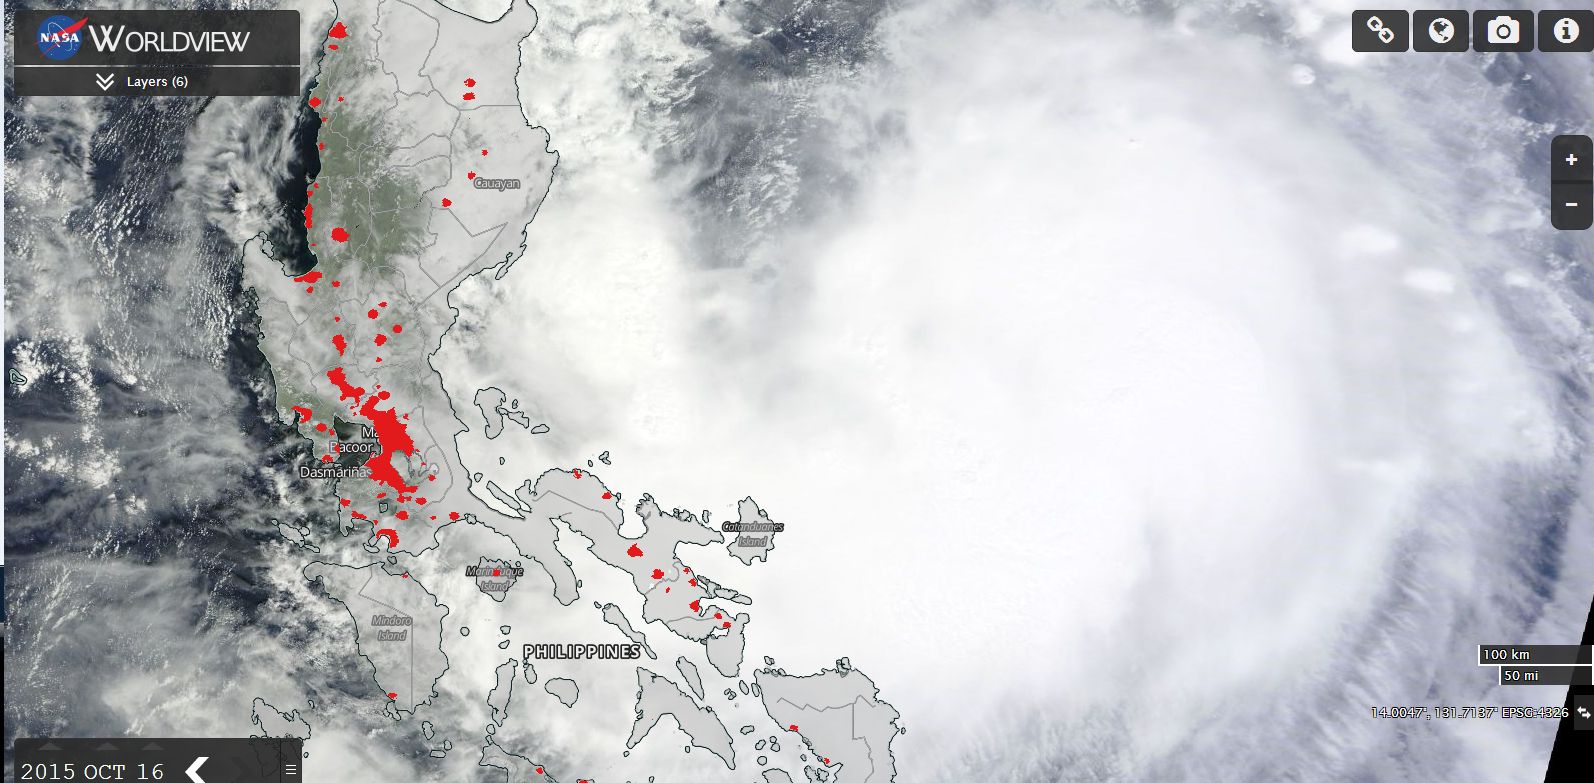
The satellite photo of the typhoon from NASA (MODIS Worldview) is showing the storm off the coast of the Philippines. The urban centres of Luzon Island have been layered over the image which provides some idea of the likely urban centres to be hit by the storm. Fortunately, the north east and northern regions of Luzon Island is not as heavily populated as the south and the worst of the storm should pass north of the capital Manilla. However, there is still likely to be some impact across Manilla from rainfall.
A population density map has also been layered over the satellite photo which also shows lower population density across the northern part of Luzon Island when compared to the south. It is suggested that the number of typhoons impacting this part of the country year by year may be contributing to the lower population especially along the coastal north east Luzon Island.
Notwithstanding this, there are still towns and cities within its path so this will still be a significant weather event.
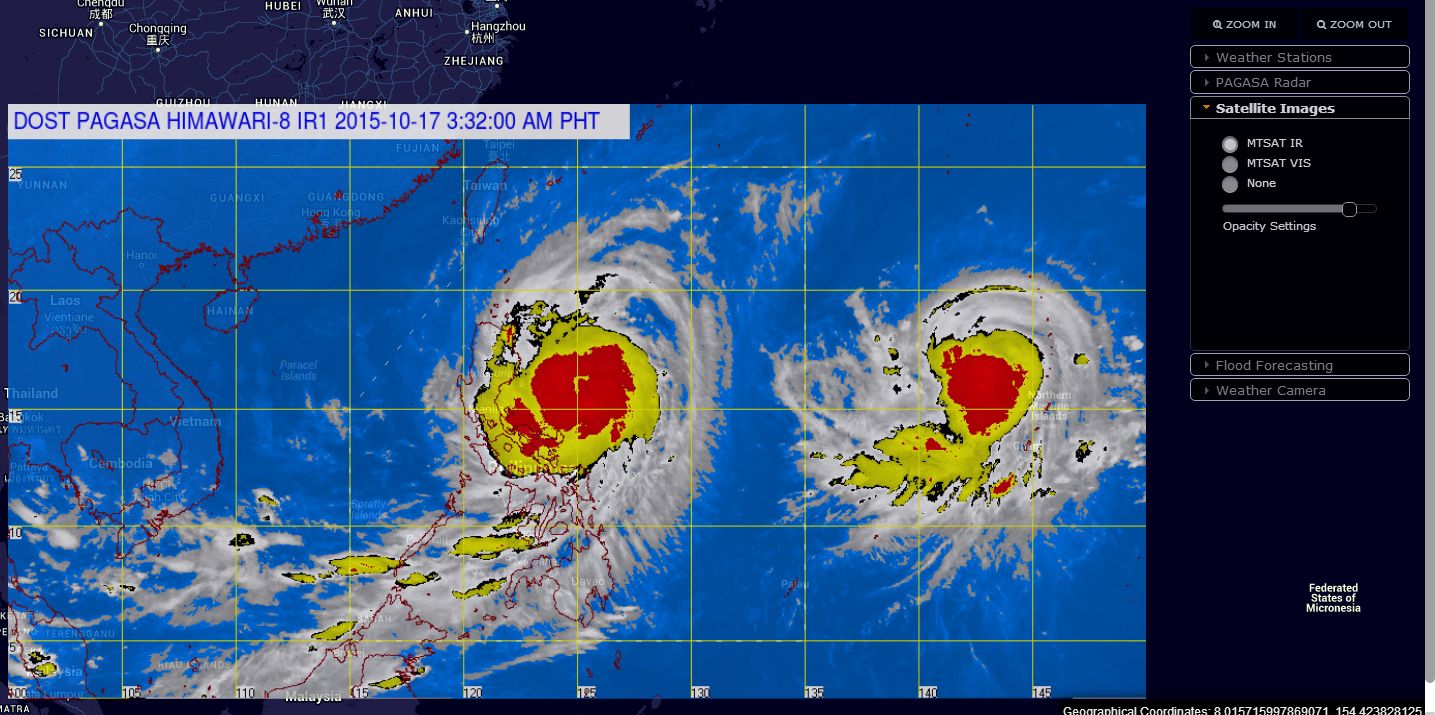
The infra red image of the storm acquired from CIMSS is showing some form of an eye and an eye is also visible on the MODIS Worldview image although it is somewhat clouded.
What happens to the storm over Luzon Island could determine what occurs next. The storm according to CIMSS and PAGASA may change track and head north as a weakened system and then threaten Taiwan. That is still not clear and will only become known once the storm clears Luzon Island. However, for the time being, the storm is still to cross Luzon Island.
Typhoon Champi
This is now a fully fledged typhoon. While it is close enough to Typhoon Koppu and visible on the satellite image attached from PAGASA, it should take a different path and remain out to sea. The storm passed over Saipan and a weather station at Saipan International Airport recorded a peak wind gust of 81 miles per hour or 130.3 km/h at 2.11 pm 16/10/15. In addition, the rain gauge here recorded 3.44 inches of rain or 87.4 mm between 12.22 and 2.11 pm 16/10/15 as the storm passed over. This could be the only verified peak wind gust that will be recorded because the storm should remain out to sea during its entire life span.
CREDITS
1 – Christopher C Burt (Extreme Weather) 2007 pp 223.
2 – CIMSS Infra red image of the storm acquired 17/10/15.
3 – NASA (MODIS Worldview) Images acquired 17/10/15.
4 – National Weather Service USA (Weather data from Saipan International Airport) 16/10/15.
5 – PAGASA (Philippine Atmospheric Geophysical and Astronomical Services Administration) for radar image, satellite photo and forecasts.