
The Hawkesbury River basin in western Sydney at the base of the Blue Mountains passes through Penrith, Richmond and Windsor. Within this area, a number of flood plains exist that are prone to flooding and there have been numerus floods recorded over the years.
The topography of the river basin contributes to the flooding in which there are five tributaries but only one outlet to let the water out.
Since 1961, there have been 29 floods recorded with the 1961 event being the largest since the construction of Warragamba Dam.
Perhaps the most significant flood according to known records is the 23 June 1867 event where a flood peak of approximately 19.7 metres was recorded at Windsor. Windsor, Richmond, and Pitt Town at that time became small islands according to records. It is also understood that 12 people from the Eather Family were killed during this event.
The largest flood since the construction of Warragamba Dam was the November 1961 event in which waters reached at least 14.2 metres (Some articles suggest up to 14.5 metres) in height at Windsor.
The current flood along the river while a significant event (Most likely a 1 in 50 year event) does not and will not reach the levels of 1961 or 1867.
The current flood peak appears to have passed with the river reaching a maximum flood peak of 12.48 metres at Windsor SWC and 12.93 metres at Windsor PWD and there is evidence to suggest that the river level may have started to fall although slowly.
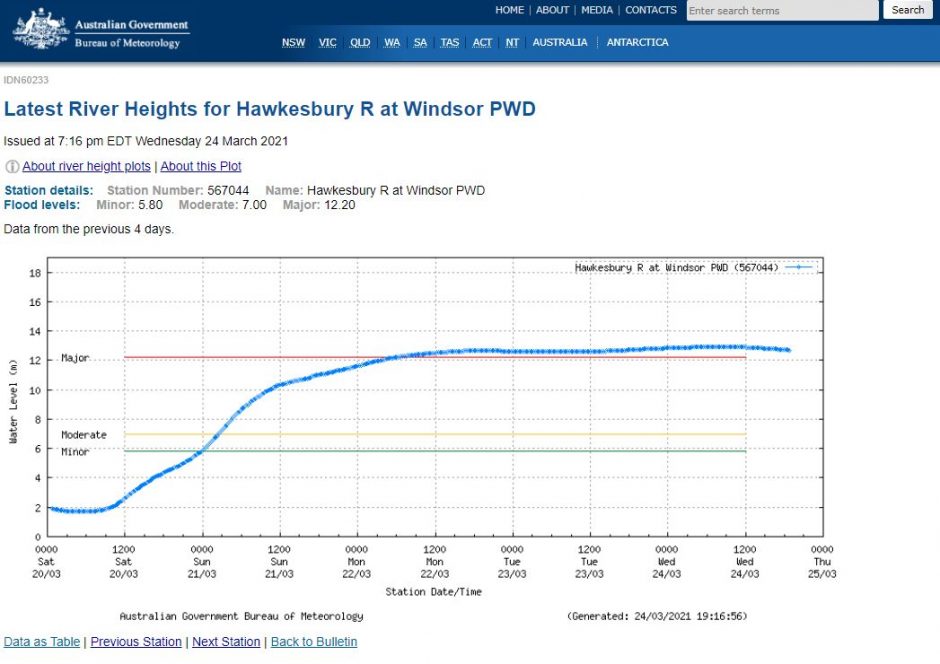
It is identified on the attached graph that the major flood level at Windsor Bridge is 12.2 metres and as at 7.16 pm Wednesday evening, the river has been at major flood level for over 57 hours. This is a considerable amount of time for the river to be at major flood level.
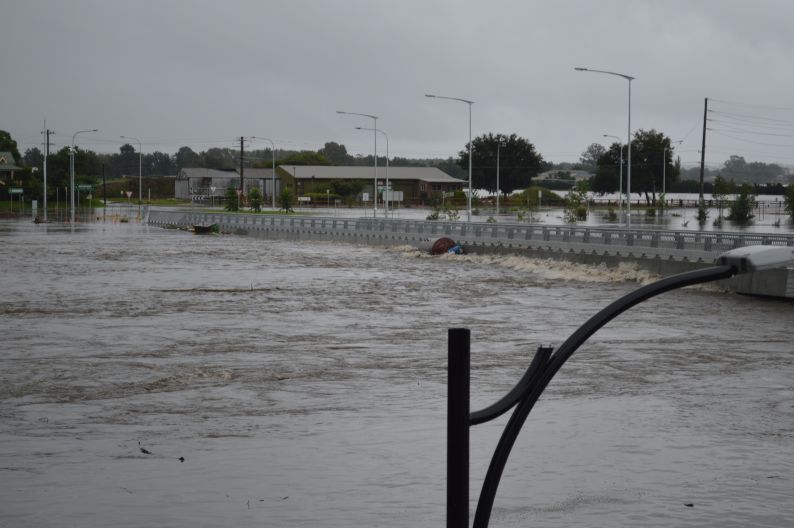
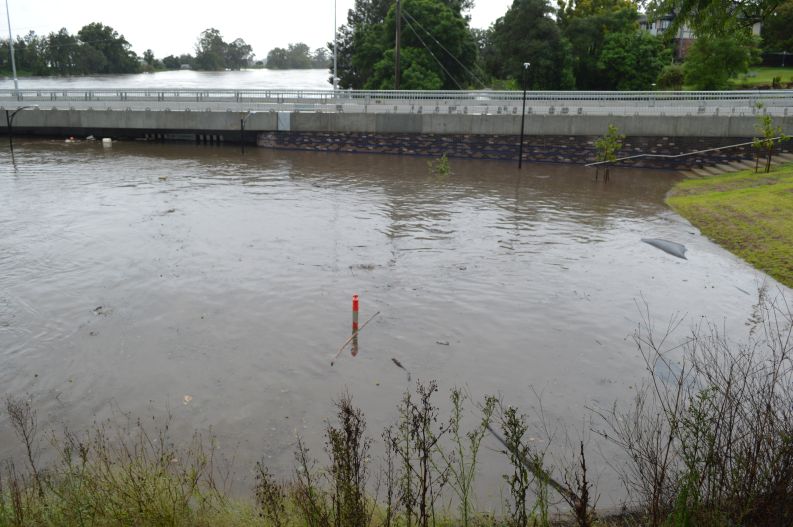
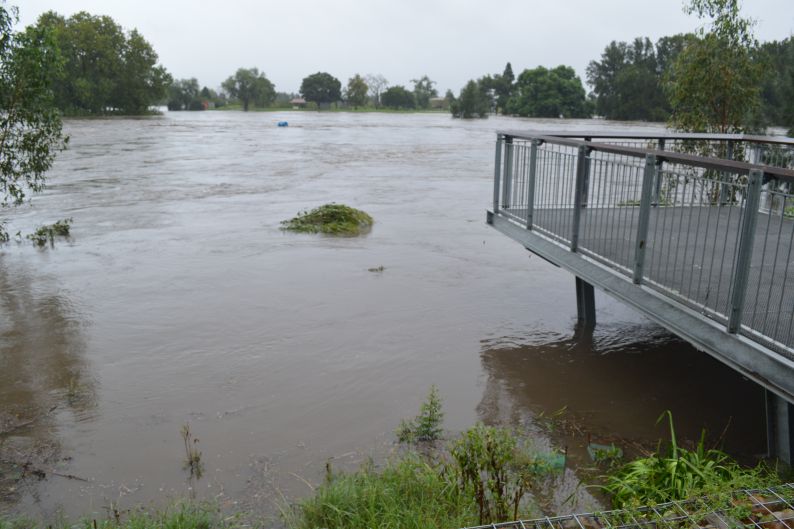
The new Windsor Bridge which was thought to be high enough has failed its first major test with the bridge being submerged especially across the western side.
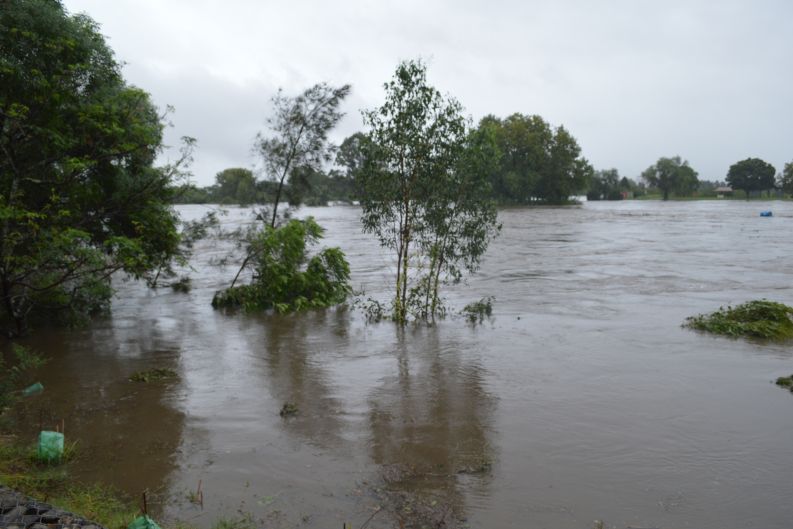
The images attached to this post were taken on Sunday afternoon prior to the maximum flood peak occurring.
This is certainly a major event with significant damage across the region to homes, infrastructure and cropping land and it is known that insurance will become an issue over coming days as claims are made.
On Tuesday 23 March, Cumberland City Council engineers explained to me in graphic detail the true potential for flooding for this area using the latest available flood maps. It is clear that higher floods have the potential to engulf much more of Richmond and Windsor urban area than that seen at the present time and it must be emphasized that this appears to be a 1 in 50 year event.
Heavy rain has again been a feature although a significant clearing trend passed over Sydney after 3 pm on Tuesday afternoon with the rain ceasing and cloud clearing out to sea. This will allow a cleanup to commence as flood waters recede.
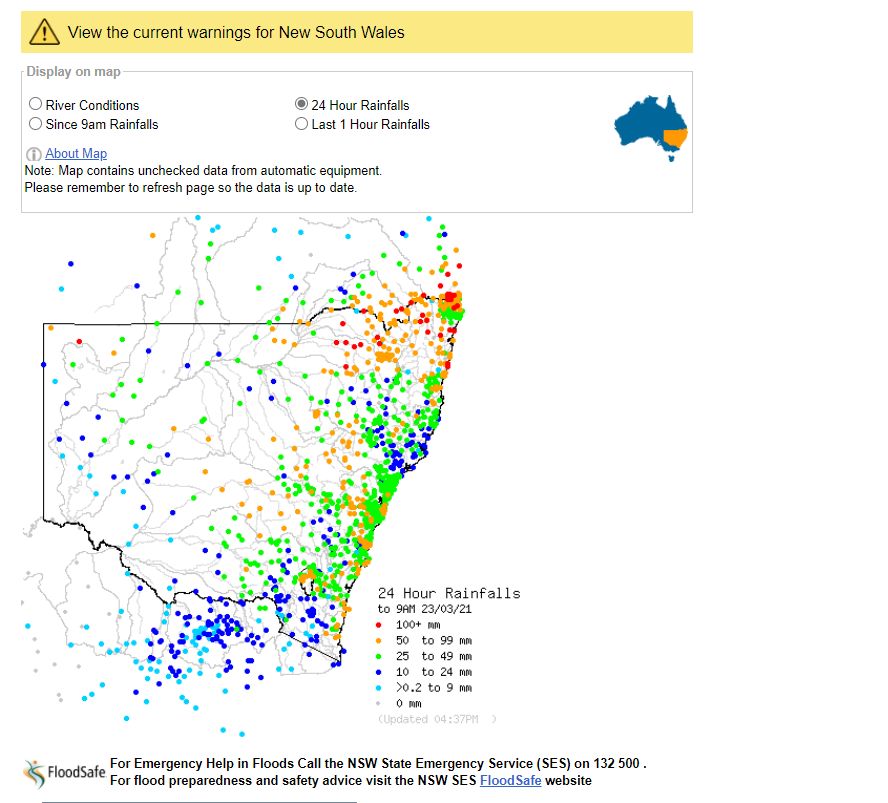
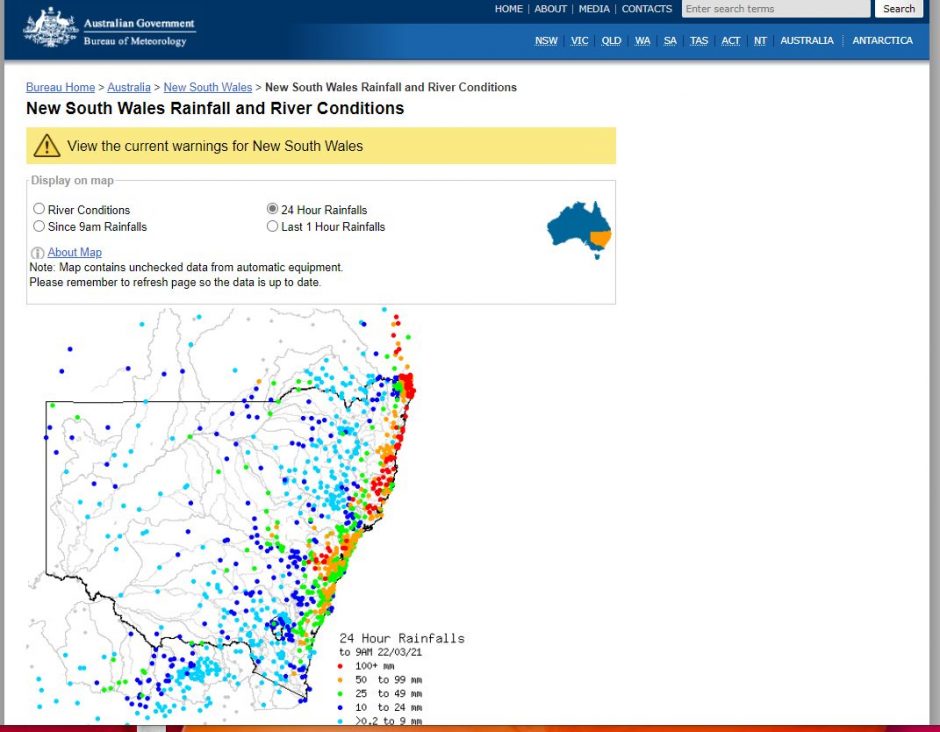
For the 24 hours to 9 am 22/3/2021 the most significant rainfalls were:-
Sydney region
Kurrajong Heights – 147 mm
Colo Heights – 105 mm
Shanes Park – 90 mm
Penrith – 88 mm.
North Coast
Mt Seaview – 203 mm.
Woolgoolga – 182 mm.
Kempsey – 180 mm.
Elands – 174 mm.
Utungun – 172 mm
Coffs Harbour – Up to 182 mm.
Willina – 166 MM.
Such scenes are repeated up and down the New South Wales coast and even into south east Queensland with significant flood events on other north coast rivers occurring simultaneously.
For the 24 hours to 9 am 24/3/2021, the most significant rainfalls were limited to the far south coast including:-
Mt Darragh 162 mm.
Bodalla 127 mm.
Brogo Dam 116 mm.
Rainfall across Sydney eased considerably Tuesday with the highest total occurring at Stone Quarry Creek being 74 mm and up to 35 mm around Campbelltown in the south west and at Portable to the north west.
The rainfall has ceased across most of New South Wales and affected areas which will now allow for a cleanup to commence which will take considerable time.