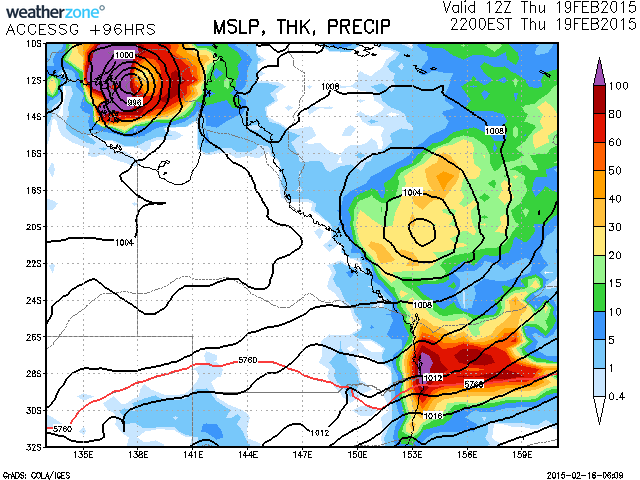
 Models have come to an agreement that an active period of heavy rain will occur from Wednesday in the north east NSW and southeast Queensland region. Falls in excess of 100mm can be expected with this event and obvious a vigorous airstream can add to some wind issues in the area.
Meanwhile, tropical cyclones may develop from any of these low pressure systems. This season has seen a below average occurrence of tropical cyclones and it seems there may be a late rush of activity with possibility of tropical cyclone off the Queensland coastline but more likely in the Gulf of Carpentaria at this stage.
After the same tropical low crossed Cape York, rainfall totals of 300mm or more fells in some locations
Ex tropical cyclone Marcia has delivered some substantial rainfalls across south east Queensland especially during the period 20 and 21 February 2015.
In additional to the heavy rains that fell when Marcia made land fall (Refer to the post on – Tropical Cyclone Marcia may reach a Category 5 Storm for details of rainfall at landfall), further heavy rains fell south of Rockhampton all the way to Brisbane. The figures to 9 am 21/2/2015 include:-
North of Sunshine Coast to just south of Rockhampton:
Moral Road Alert – 207 mm.
Callide Dam – 198 mm.
Borumba Dam – 195 mm.
Yielo Alert – 194 mm.
Upper Dee TM – 193 mm.
Mt Gayndah – 190 mm.
Oakwood – 187 mm.
Walca Range Alert 183 mm.
Abercorn – 173 mm.
Being the highest figures.
Its interesting to note that the heaviest falls have occurred inland from the coast with the highest falls occurring in a narrow band south east from Rockhampton towards the Sunshine Coast.
The plot is shown below.
Some of this rain has led to flooding of low lying areas and within river courses which is receiving plenty of media coverage.
Sunshine Coast Rainfall
This system has resulted in substantial rainfall occurring across the Sunshine Coast. Rainfall appears to have been slightly heavier across the region and some rainfall totals have topped 250 mm. The highest falls include:-
Caboolture – Bribie Island Road – 272 mm (The highest total).
Beachmere – 269 mm.
Ewen Maddock Dam and Sunshine Coast – 257 mm.
Landsborough – 253 mm.
Landsborough Alert – 250 mm.
Old Gympie Road – 242 mm.
Beerwal – Alert 238 mm.
Mawsons Road – 238 mm.
Maroochydore Depot Alert 231 mm.
Glasshouse Mountains – 229 mm.
Caboolture – 215 mm.
Sunshine Coast – 214 mm.
Godwin Beach – 209 mm.
Caboolture (Short Street) 207 mm.
Sugarlog Road WTP – 206 mm.
West Woombye Alert – 203 mm.
Cooran Alert – 201 mm.
These are within the highest figures for the region.
Brisbane Rainfall
The system has impact much of Brisbane although the northern regions of the city were worst affected with lighter falls further south and west.
The Brisbane rainfall plot is provided below.
The highest totals for Brisbane using the plot include:-
Rothwell Alert – 204 mm (The only 200 mm total for the city region).
Lake Kurwongbah HW – 193 mm.
Lipscombe Road – 192 mm.
North Coast of New South Wales
For the same period, some heavy rain also affected the New South Wales North coast. While rainfall was not as heavy, some substantial totals occurred. I was aware of some issues of flooding being reported in the media but not significant. For the 24 hours to 9 am 21/2/2015, the heaviest totals include:-
Couchy Creek – 157 mm.
Goonengerry – 148 mm.
Byrom Bay – – 141 mm.
Tuckombil – 135 mm.
Boat Harbour – 135 mm.
Back Creek – 118 mm.
Wooli River Caravan Park – 104 mm.
The area around Coffs Harbour received from 59 to 89 mm.
This is shown on the plot below.
For the 24 hours to 22/2/2015, rainfall tapered away but still some moderate to large falls occurred including:-
Woolgoolga – 78 mm.
Wooli River Caravan Park – 72 mm. (This is a combined total of 176 mm across the 2 days).
Boonangha (West of Kempsey) – 72 mm.
Coffs Harbour (Varied from 46 to 74 mm depending on suburb). This shows that Coffs Harbour had cumulative totals well over 100 mm for the 2 day period.