The month of November 2022 is described as a month of significant contrasts. Exceptional rainfall continued across much of the Murray Darling Basin especially across the southern inland areas but conditions started to dry out along the coast.
The month was punctuated by key rainfall events with the most significant being the event of the 13 to the 16 November where major flooding resulted across key inland rivers including the Lachlan, Murray and Murrumbidgee including their tributaries. The flood peak is now moving downstream along the affected rivers towards South Australia. Towns and cities such as Forbes, Condobolin and Eubalong were hit hard by the flood event.
To date, media reports estimate the flood damage across New South Wales at greater than $5.5 billion and climbing as more assessments and insurance claims are made.
However, it is also noted that the last 7 to 10 days of the month were much drier allowing for some drying to occur.
Lack of heat
Of critical importance is the lack of heat across the southern areas including the lack of days where 30 degrees have been reached. Even across Sydney, the maximum temperature has failed to reach 30C across most suburbs.
To highlight this, the maximum daytime temperatures has failed to reach 30 degrees once this season to date where I live which is most unusual. Even in Penrith (Western Sydney), the maximum daytime temperature has not reached 30C with 29.9C being the highest recorded on the 25th.
It is identified that a temperature of 30C was briefly reached within a small area between Parramatta / Sydney Olympic Park and Bankstown on Sunday afternoon of the 27th but elsewhere, maximum daytime temperatures only reached the mid to high twenties across Sydney.
Even in places such as Albury and Wagga and much of Victoria and southern New South Wales, a similar weather situation has unfolded.
A combination of La Nina, constant rainfall and cloud cover has kept the maximum daytime temperature down on what should be occurring at this time of year.
Lack of thunderstorm activity Western Sydney
Across Sydney, there were two significant rain events with the most significant occurring during the early hours of the 14th and a less significant event occurring late Sunday on the 27th.

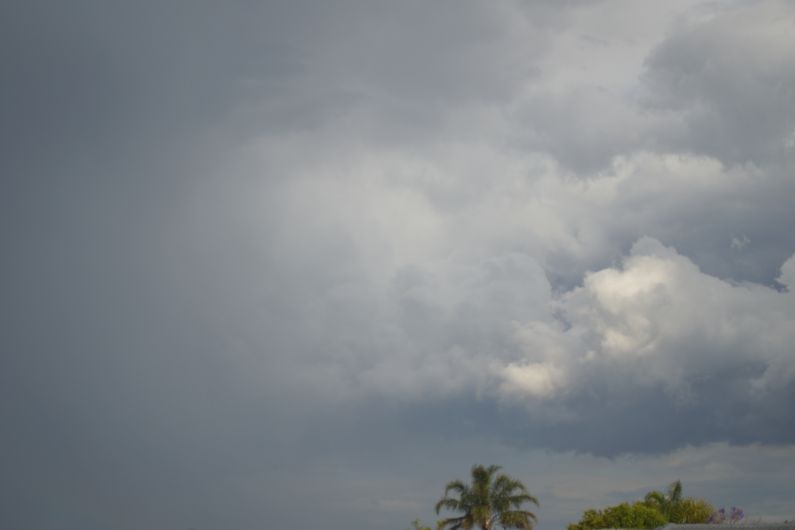
There was a lack of any strong thunderstorm activity with the only thunderstorm events of any significance being minor events late Sunday afternoon 27 November. While media reports and photos uploaded to social media platforms showed more interesting cloud formations elsewhere including hail events, the storms that passed over Western Sydney between Penrith and Blacktown during Late Sunday afternoon lacked any distinct structure and were generally weak. It was also difficult to obtain photos of cloud structures with the best two incorporated into this statement.
A single thunderclap was heard on the morning of Sunday 13 November from a passing shower which did not warrant any storm chase.
November Rainfall
All the rain events that have occurred are covered in separate statements. Coastal rainfall is significant but now, new rainfall records have been broken across the inland areas of the Murray Darling Basin.
The table below shows the rainfall as it stands for the period 1 January to the 30 November 2022.
| Sydney Region | November 2022 | So far for 2022 | Comment |
| Parramatta | 45.8 mm on 8 days. | 1,768 mm. | |
| Penrith | 41.6 mm on 8 days. | 1,582 mm. | |
| Richmond | 40 mm on 8 days. | 1,482.6 mm. | |
| Sydney Observatory Hill | 55.6 mm on 13 days. | 2,451.8 mm. | Wettest year recorded. |
| Home (Comparison and guide only) | 47.3 mm on 7 days. | 1,691.3 mm.
|
It is calculated that rain has fallen on 159 days throughout the 11 months of 2022 to November 30. |
| North Coast NSW | October 2022 | So far for 2022 | Comment |
| Ballina | 27.2 mm on 7 days. | 2,776.8 mm. | |
| Coffs Harbour | 19.8 mm on 10 days. | 2,502.2 mm. | |
| Dorrigo | 28.5 mm on 7 days. | 2,830.2 mm. | |
| Grafton | 20 mm on 7 days. | 1,564 mm. | |
| Port Macquarie | 46.4 mm on 11 days.
|
2,312 mm. | This could now be incorrect given that the weather station was not recording between the 21 and 26 October.
The final figure for 2022 will be in doubt for the records. |
| Wheat Sheep Belt NSW | October 2022 | So far for 2022 | Comment |
| Albury Airport | 191.8 mm on 12 days. | 1,242.6 mm. | Incredible rainfall has fallen where more than 100 mm has been exceeded for the 4 months between August and November.
Rainfall has topped 530 mm for spring which is a new weather record. |
| Dubbo | 43.8 mm on 10 days. | 1,022.4 mm. | Rainfall has exceeded 1,000 mm for the year to date. |
| Forbes | 169.5 mm on 8 days. | 971.4 mm. | This includes 118 mm on the 14th.
This event contributed to major flooding of the region. |
| Tamworth | 95.8 mm on 8 days. | 884.6 mm. | No rain fell during the last 2 weeks of the month. |
| Wagga Wagga | 87mm on 9 days. | 737.6 mm. | This figure is not correct as the weather station failed to operate between the 13 and the 16. As such, the final figure for November and for the rest of 2022 will be in doubt due to this issue. |


Discussion Water and the Land plots
Attached are relevant Water and the Land Plots showing rainfall for November 2022 to reinforce the discussion above. The standout figures are:
- Much of the eastern Murray Darling Basin had rainfalls between 100 and 200 mm for the month with isolated higher totals occurring within the higher areas of the Great Dividing Range. In other areas, widespread falls of 50 to 100 mm were common.
- Rainfall was very much above average for much of the southern areas of the Murray Darling Basin with isolated pockets receiving rainfall that was the highest on record.
- Areas along coastal New South Wales and Queensland were much drier with average or slightly below average rainfall occurring. While not of concern, rainfall was very much below average for the Richmond / Tweed area of New South Wales.
In addition:
- Rainfall for the period September to November was the highest on record across a large portion of the southern Murray / Darling Basin as shown on the 3 month rainfall deciles plot. Further to this, spring rainfall of 400 to 600 mm were common across the inland North East New South Wales and inland southern areas of the state extending into most of North East Victoria.
- Generally, the whole of southern Australia experienced a cool wet spring with many new rainfall records being broken. The maximum and minimum temperature anomalies for November for New South Wales are included as the plots show how cool November has been. The lack of heat and 30C days plus rainfall has contributed to cooler than normal averages.


Comments
1 - All rainfall and historical rainfall used is sourced from BOM historic data and data from official weather stations.
2 - While I have a rain gauge set up in the rear yard, it is only being used as a guide but it is noted that it is relatively consistent with official figures occurring at nearby Prospect and Horsley Park where official weather stations are established.
3 - The La Nina episode is expected to wane early 2023 and forecasts are being made for a significant reversal of climate drivers to more El Nino like conditions for late 2023.

