The month of January 2022 has been a month of wide weather extremes across much of Australia with few exceptions. It has been a month of significant and damaging storms in some areas, flooding events and heatwaves especially across the western part of the continent.
A comparison is made between Sydney and Perth. Along the east coast of Australia, constant easterly winds have been providing ample moisture for cloud and rain which has resulted in cooler than normal daytime conditions.
By the time, the winds have reached the western part of the continent, the air has totally dried out. For example, Sydney City (Observatory Hill) recorded 166.2 mm of rain across 15 days while Perth in Western Australia received “Nil” rainfall for the month.
The La Nina episode has been responsible for the above average rainfall.
Inland, New South Wales, major thunderstorms featured and numerous rainfall records have been broken. One particular location which stands out is Albury Airport where at least 5 major storm events occurred across Albury / Wodonga city and accumulative rainfall reached 306 mm. A closer look at this reveals that 317.8 mm fell at the nearby Hume Reservoir weather station just to the east however, surrounding areas such as Rutherglen only received 133.8 mm (To the west) and Hunters Hill received 216 mm (To the east).
Such rainfall totals are remarkable for such a location especially where the normal January average is just 39.3mm and the climate tends more towards “Mediterranean” in some years. Storms have caused significant damage to the region area and a cleanup is continuing especially in relation to fallen trees. It is known that disaster relief funds are being made available to assist in the cleanup effort.
During January Sydney City received:-
- 166.2 mm of rain across 15 days.
- Just 3 days where it reached 30C with the highest being only 30.2 on the 8th plus 30C on the last 2 days of the month.
- An Average Max 27.7C and an average Min of 20.6C.
Further inland at Blacktown, there were just 7 days where it reached 30C. It has only reached 30C on 13 days for the December and January period and only 19 for the entire spring / summer season to date. Generally, there were no days where it reached 35C or higher.
As a comparison Perth received:-
- Nil rainfall.
- 6 days where it reached 40C with the highest being 42.2C on the 19th (Total of 11 such days for the summer 2021/22 at the time of writing).
- 21 days where it reached 30C or higher.
- An Average Max 33.7 and an average Min of 19.1C.
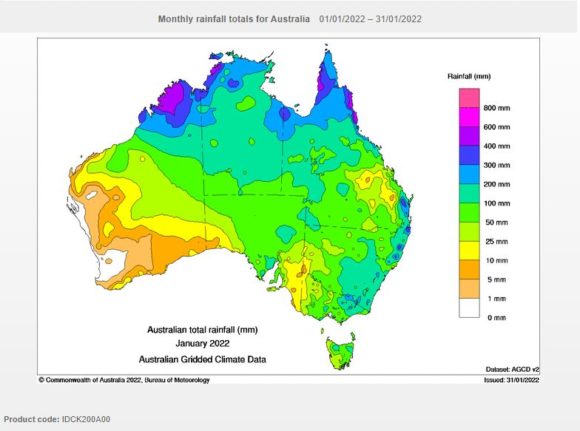
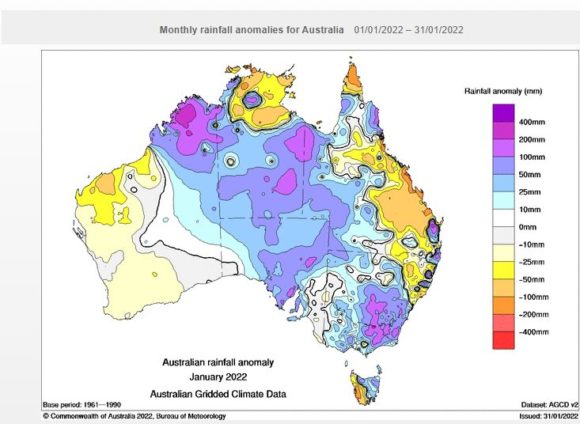
Constant cloud and rainfall has been a feature for much of the eastern half of the continent and a closer review of the attached plots (Generated on the Bureau of Meteorology Water and the Land site) generally show:-
1 - The eastern, northern areas and many inland areas of the continent being wet with small areas being saturated by impressive totals reaching as much as 400 to 600 mm along portions of the Western Australian and Queensland coasts.
2 - The south west area of Western Australia being exceptionally dry with no rainfall being recorded.
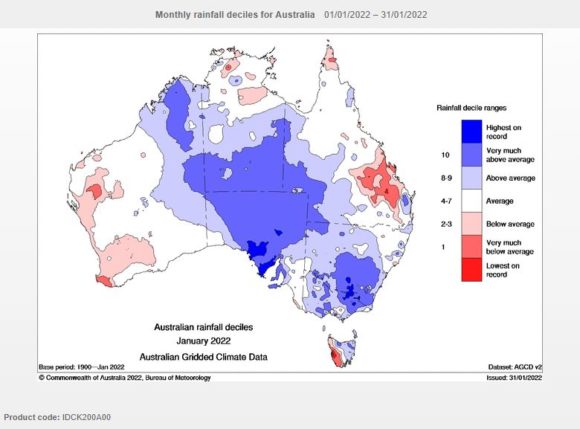
Monthly deciles
The inland southern areas of the Murray Darling Basin and vast regions of South Australia and Southern Northern Territory received “Very much above average rainfall”. When reviewing this more closely, pockets of the southern Murray Darling Basin and Southern South Australia received rainfall that was the highest on record.
The Western areas of Western Australia were dry with below average rainfall although some portions of Central Queensland were also drier than normal for the month.
Rainfall anomalies
The plot shows that vast areas of South Australia and the desert areas of Northern Territory and southern New South Wales received rainfall anomalies that were well above average. A portion of the Kimberly region and around Albury/Wodonga region received an anomaly that was in the range of 200 to 400 mm above average, amongst the highest in the country.
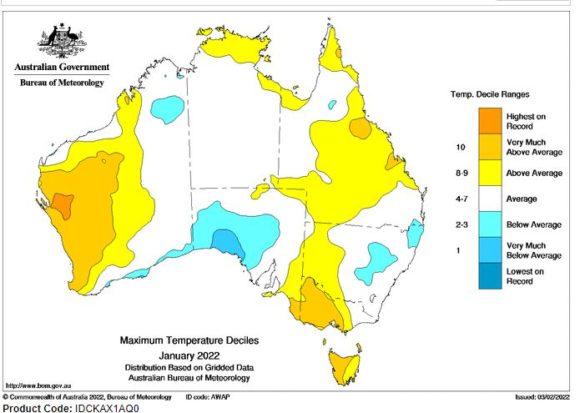
Average Daytime Temperatures
Coupled with the higher than normal rainfall and incidence of storms across many areas, the maximum temperature anomalies for January shows large areas of New South Wales and Victoria enjoying average or below average temperatures. Even in South Australia, it was cooler than normal for a significant portion of the state.
Only Western Victoria, Western New South Wales, a large belt of Central Queensland, western areas of Western Australia and the Top End of the Northern Territory and Tasmania experienced temperatures that were considered above average for that location.
Another feature is the lack of significant heatwaves across Eastern Australia and the clear lack of days where maximum temperatures have reached or 35C or 40C. There were no such days across Western Sydney and even in places like Albury or Wagga Wagga where such days are common during the month, it only reached 35C or higher on only 1 day for the month.
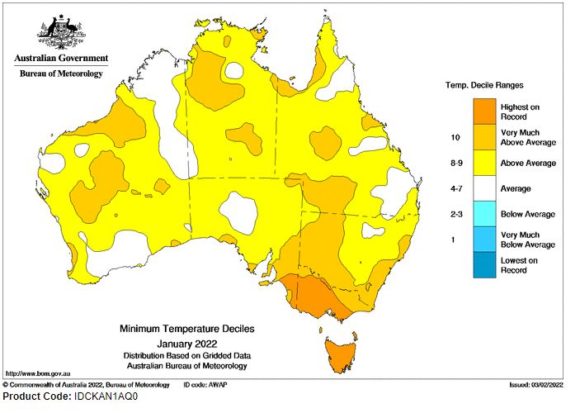
Average Nighttime Temperatures
The minimum nighttime temperatures have been generally above average across most regions of Australia as cloud cover at night has acted like a blanket keeping in the daytime warmth.
When reviewing all the plots for January, this La Nina episode is having a dramatic impact on lowering temperatures across many areas and producing higher than normal rainfall with some localities experiencing exceptional weather events.
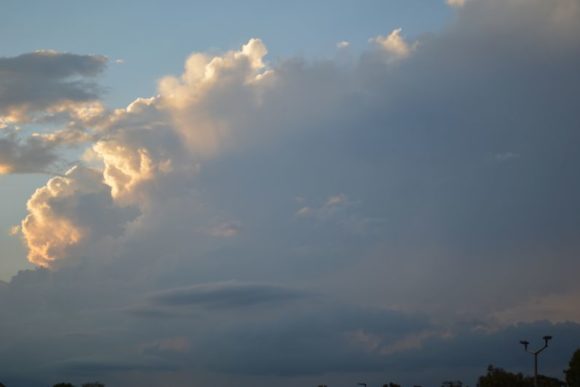
Cold front Monday to Tuesday 31/1/2022 to 2/2/2022
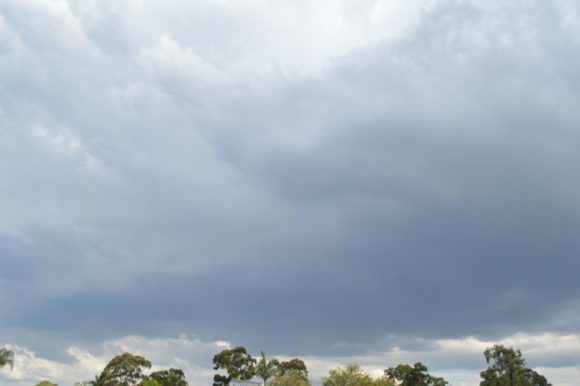
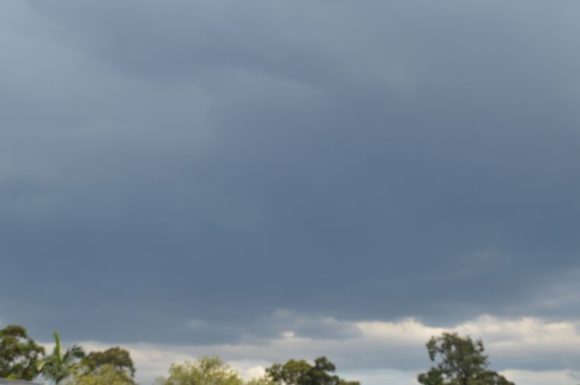
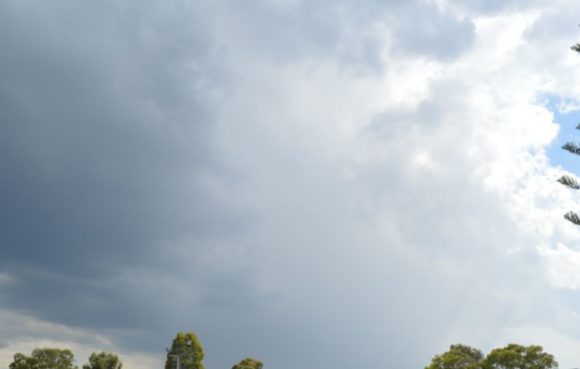
Between Monday 31 January 2022 and Wednesday 2 February 2022, a significant frontal system / wind changed passed across southern Australia that brought a much drier air mass across inland Southern areas of the continent which was strong enough to clear away the rain and storms and to allow for a lengthy dry period to commence. This will allow for cleanup operations, saturated river catchments to dry out and for flooding to subside. This system passed over Sydney generating weak thunderstorm cells as shown in the images but none of these had significant intensity.
The storm shown on Monday evening was convective in nature but decayed after sunset while the second storm shown of Tuesday was fast moving but was not severe.
The same system generated a significant thunderstorm across parts of Brisbane on Wednesday that brought hail, damaging winds and as much as 54 mm of rain to some southern suburban areas such as at Forresdale.
The wet conditions of this summer have continued along the east coast with coastal showers following the change while the inland has been influenced by a more drier air mass which is more normal for this time of the year.