
 Hi Guys,
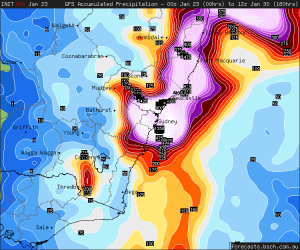
Just check out the latest Jan 23 00z GFS 180 hour accumulated precip.
http://forecasts.bsch.au.com/apf.html?region=sydney&start=5&stop=6&gribdate=2013012300&chart_mode=
Most appears to fall in the few days post Australia day. I might have to get around to sorting out the drainage / downpipe issues I've been having at home hehe.
Regardless of what happens this far down in central NSW, it will be interesting to watch this event unfold along the QLD coast with the demise of Oswald. Interesting times ahead!
Today I had the benefit of driving back from Batemans Bay to Sydney and during that process, I was able to drive a cross section through this low pressure cell experiencing several weather scenarios.
Overnight Batemans Bay had 59 mm of rain and some of that was quite heavy especially between 11 pm and 8 am 28/1/13. That was not causing any issue as the rain was soaking into the ground. This rain was highly coastal. As I reached Clyde Mountain, I broke out of the low cloud and rain and found that it was dry further west at Braidwood. If I had gone further west to Canberra, I would have been under clear skies and I could tell sunshine and clearer skies dominated. I discovered that very little if any of this rain was penetrating much beyond the coastal strip and areas immediately adjacent to the eastern side of the Great Dividing Range across south east New South Wales.
I drove back into light rain near Berrima but it was mainly drizzle. It was only when I descended into the Cumberland Basin did I strike the heavier rainfall now affecting Sydney. As I write this, rainfall across Sydney ranges from 25 to 45 mm with heavier falls towards the coast and lighter falls inland.
I could make out that the rain system was moving south along the coast but there was little surface wind across the southern tablelands.
I did not experience or see any thunderstorm activity during the cross section drive but some thunderstorm activity has since developed late afternoon across parts of the south west slopes beyond the influence of the cloud and rain.
Interestingly, I was able to observe the various cloud decks including the high cirrus layer, the cirrus stratus layer, broken stratus cloud and alto stratus cloud forming this cloud mass becoming more and more dense as I approached the coast from the south west. Eventually, the cloud masses merged as I approached the coastal ranges into thick enough clouds delineating the rain bands.
I will post some rainfall figures once the rain event concludes.
Michael Bath posted a track map of Tropical Cyclone and ex-Tropical Cyclone Ozwald as it moved down the Queensland coastline.
I have started to look at rainfall data and some of those falls are impressive. The falls are widespread and heavy right along the NSW coast. Numerous centres in coastal NSW received from 150 to 200 mm on Monday from this event. On Monday, I discovered a fall of 289 mm at Crystal Creek (Bellingen) being the highest. Another unusual feature occurred around Coffs Harbour. Rainfall within Coffs Harbour varied by 100 mm from 104 mm to 206 mm. The highest fall in Sydney was 161 mm near Terry Hills and Chatswood but only 95 mm at Observatory Hill. Falls on Monday were heavy but some really heavy falls were truly concentrated and localised to small areas.
On Monday 28 January and early Tuesday 29 January 2013, the rain event passed over Sydney and some significant rainfalls occurred. Rainfall was mostly uniform across Sydney although a small number of rain guages may not have been working properly. A rain guage at St Marys suggest only 13 mm and another in Baulkham Hills suggests 17 mm whereas all other rain guages recorded anywhere between 50 mm up to 161 mm.
The highest figure is a fall of 161 mm around the eastern side of Chatswood on the North Shore. Other falls include 118 mm at Dee Why, 103 mm at Bondi, 117 mm at La Peruse, 105 mm at Sydney Olympic Park, 117 to 119 mm at Campbelltown, 112 mm at Richmond and 102 mm at Penrith.
Around Blacktown falls ranged from 101 mm at Prospect to 76 mm towards Kings Langely.
Generally, big rainfalls are more or less evenly spread across the city.
Looking more widely across New South Wales, it is identified that this event affected the eastern half of the state with little or no rainfall penetration across the inland. The cut off appears to be the north west, central west and south west slopes.
The heaviest falls for Monday and early Tuesday morning include the following:-
1 – Clarence Hall Dam 215 mm, Numinbah 211 mm, Goonergerry 207 mm and Limpinwood Bald Mt 204 mm. The localities are situated in the Tweed River area of the state.
2 – A very heavy fall of 289 mm fell at Bellingen (Crystal Creek) and 202 mm at Lowanna. Around Coffs Harbour, rainfalls varied by some 100 mm with rain guages recording anywhere between 104 and 206 mm. The variation is substantial across a small area.
3 – Around Port Macquarie, a rain guage at Comboyne Public School recorded 152 mm and Foster had 160 mm.
4 – In the Hunter Valley, 148 mm fell at Scone and Nullo Mountain. While in Singleton 1/2/2013, I discovered that a flood had passed along the Hunter River. The river banks and flood levies had held back the flood but clear evidence of the flood was seen including a film of mud across playing fields and low lying areas. The Hunter River was flowing rapidly and heavily coloured brown, full of sediment.
5 – At Wollongong, 168 mm fell at Mt Pleasant and a heavier fall of 184 mm occurred at Clover Hill.
6 – Point Perpendicular at Jervois Bay received 172 mm.
Again, the concentration of the big falls were mainly along the coast east of the coastal ranges.
Looking more at the national picture, the map showing rainfall “Week ending 28 January 2013” shows the rain event along coastal Queensland and into NSW. The heaviest falls are concentrated along the Queensland Coast which explains the flooding at Rockhampton, Bundaberg and Brisbane.
The very heavy falls occurred north of Brisbane to Rockhampton, an area around Townsville and large areas of Cape York Peninsular.
The entire coastal stretch of Queensland received falls of 200 to 400 mm and some of this occurred over NE New South Wales.
It is also shown that some rainfall did penetrate into the inland regions but they were lighter. Very little rain made its way into southern and western New South Wales and Victoria.
This plot and others are produced on the “Water and the Land” site specific for rainfall.
I have also prepared one rainfall plot for the week ending 29 January and this shows the rain event more pronounced across Eastern New South Wales.
Areas just north of Sydney near Newcastle are marked in purple colours indicating the heavier rainfall. Falls of 100 to 150 mm affects the New South Wales South Coast.
Its also interesting to see a state of two halfs with the eastern half receiving a soaking but little rainfall penetration across the inland of the state and most of Victoria. The eastern part of Victoria did receive some falls from this event.
Overall, it is shown that this was mainly a coastal event. Some useful falls did occur over North West slopes of New South Wales. The good news of this is that there was enough rain (Up to 50 mm) around Coonabarabran to contain the fire that recently impacted the nearby national park.
The 83mm of rain at Box Hill (I think) mnatches well with my 84.2mm of rain. However, I measure between 7:30am to 7:30am. Some reasonably high totals and definitely welcome!
Flood-hit Queenslanders may be moved to higher ground Finally! Some sense prevails! http://www.weatherzone.com.au/news/flood-hit-queenslanders-may-be-moved-to-higher-ground/23522
Flood-hit Queenslanders may be moved to higher ground Finally! Some sense prevails! http://www.weatherzone.com.au/news/flood-hit-queenslanders-may-be-moved-to-higher-ground/23522
Jimmy's brunch hahaha j'/k…………..weather weather lang :)
Furthermore, I am not sure what the current laws are on building in flood prone regions, but if so they require to be changed as they did in NSW after the 1955 floods!
I have been thinking about this even for the regional centres of Rockhampton, Bundaberg and Mackay. Perhaps portions of these centres should be moved to higher ground where flooding is less likely. It will be an expensive undertaking but you cannot keep having floods impacting major population centres. The clean up is just so expensive. It has been done in the past for smaller towns. The best way to lessen future flooding cost is to relocate people to safer areas off the flood plains. That raises other questions like who should pay for it.
I am a town planner at Auburn City Council and flooding must be addressed. What we do is if a new dwelling house is to be constructed in a flood risk area, the applicant must prepare a flood study. That flood study would determine the flood levels. Often or not a new dwelling house must be at least 500 mm above the 1 in 100 year flood level. That is the freeboard. It must be a minimum height above that 1 in 100 year level. The aim of that is to prevent water geting inside the dwelling house during a flood. It is preferable to raise the dwelling house on piers so water can flow underneath. The flood must not be impeded. That is what we do.
We are paying for the floods through the levy and now they were thinking of a permanent levy! I hope the relocation program goes ahead!